

Question
Please answer all. Thank you. The following 2 pictures are the Consolidated Balance Sheet The following 2 pictures are the Consolidated Statement of Cash Flows.
Please answer all. Thank you.
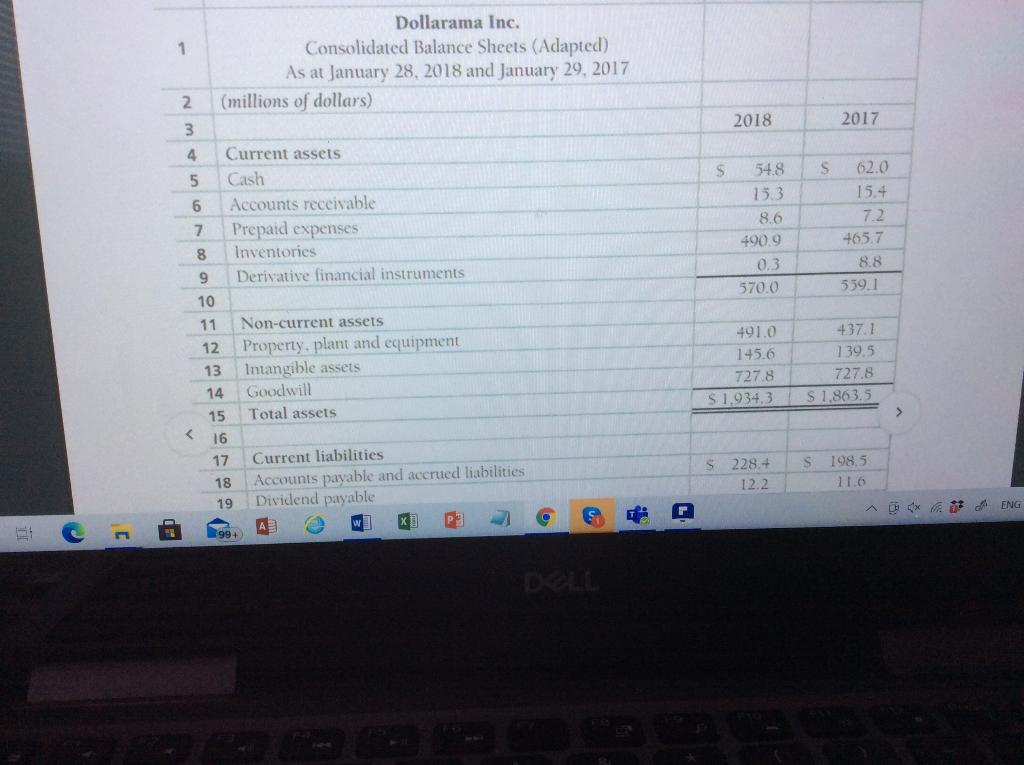
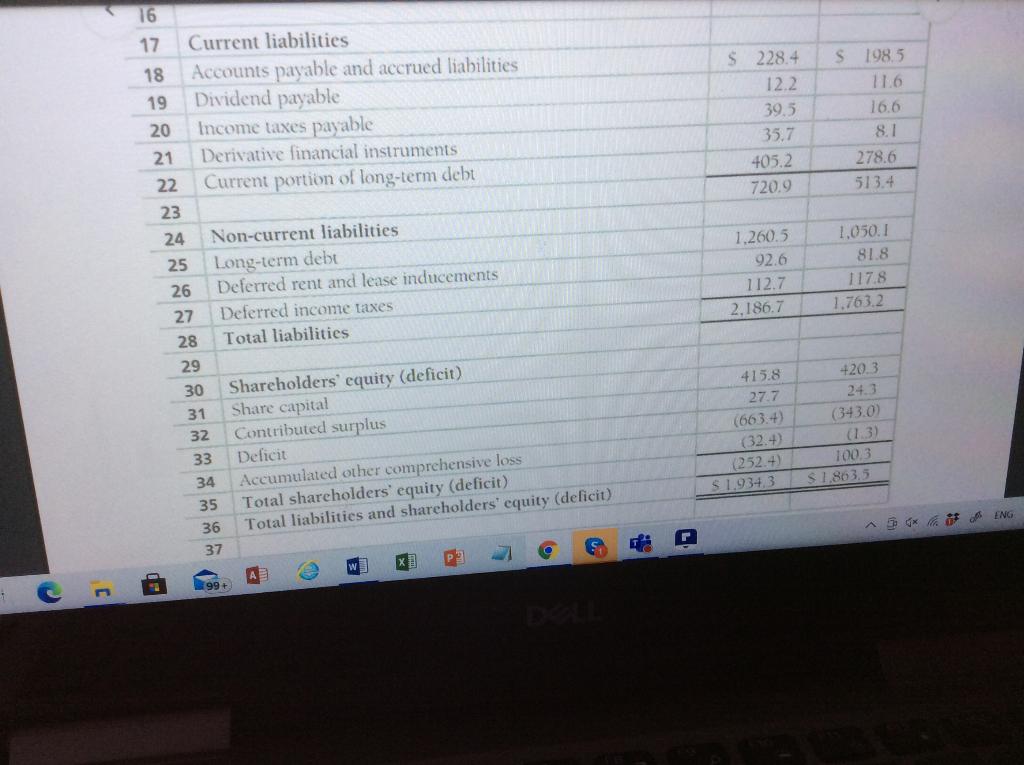
The following 2 pictures are the Consolidated Balance Sheet
 The following 2 pictures are the Consolidated Statement of Cash Flows.
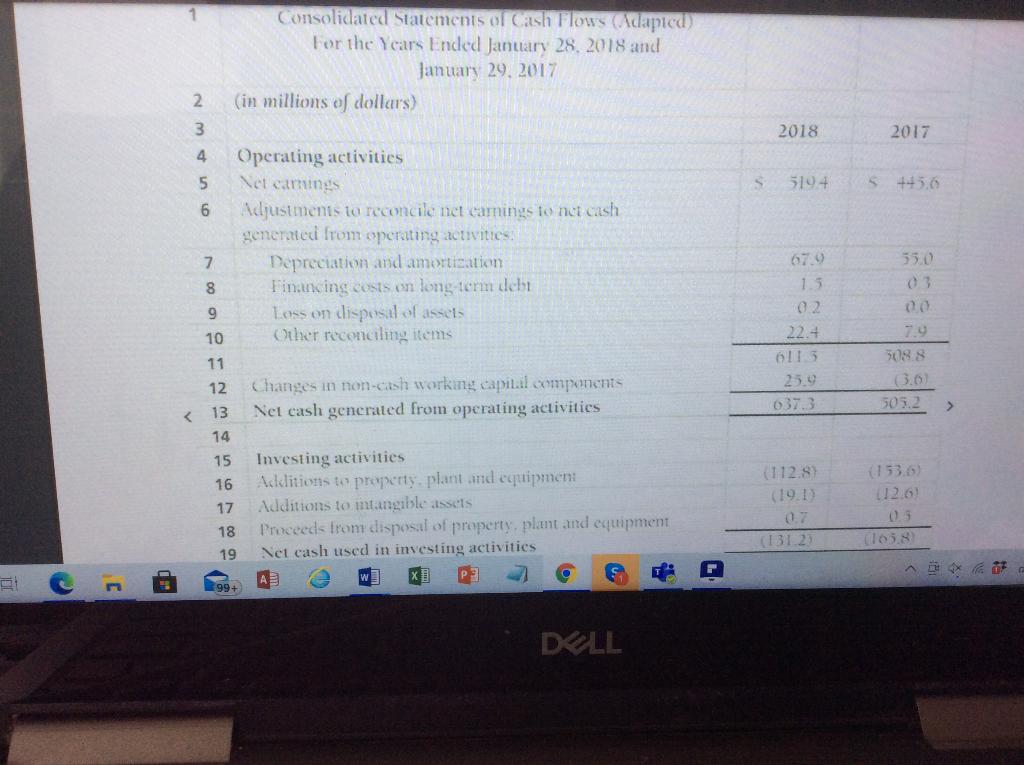
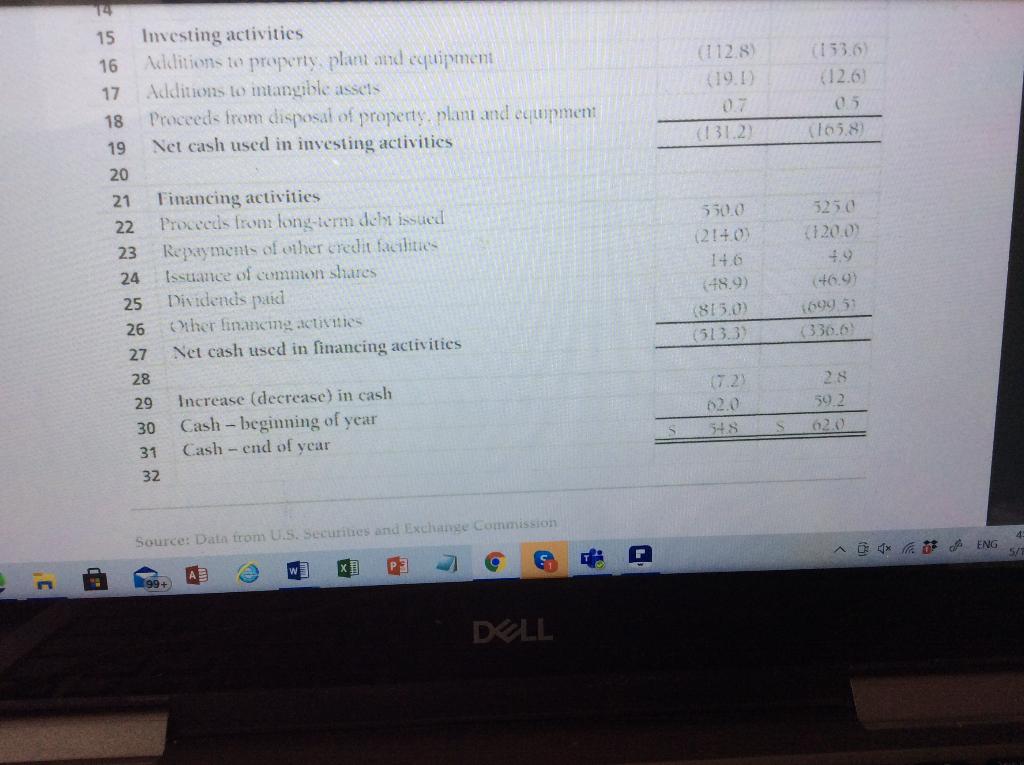
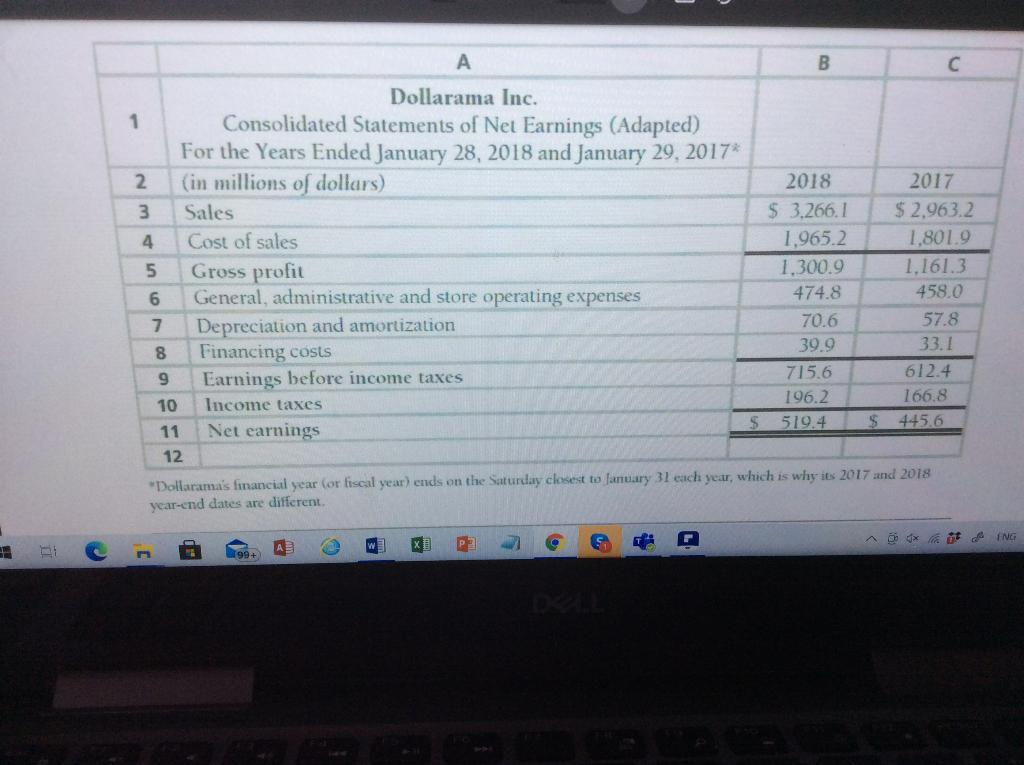
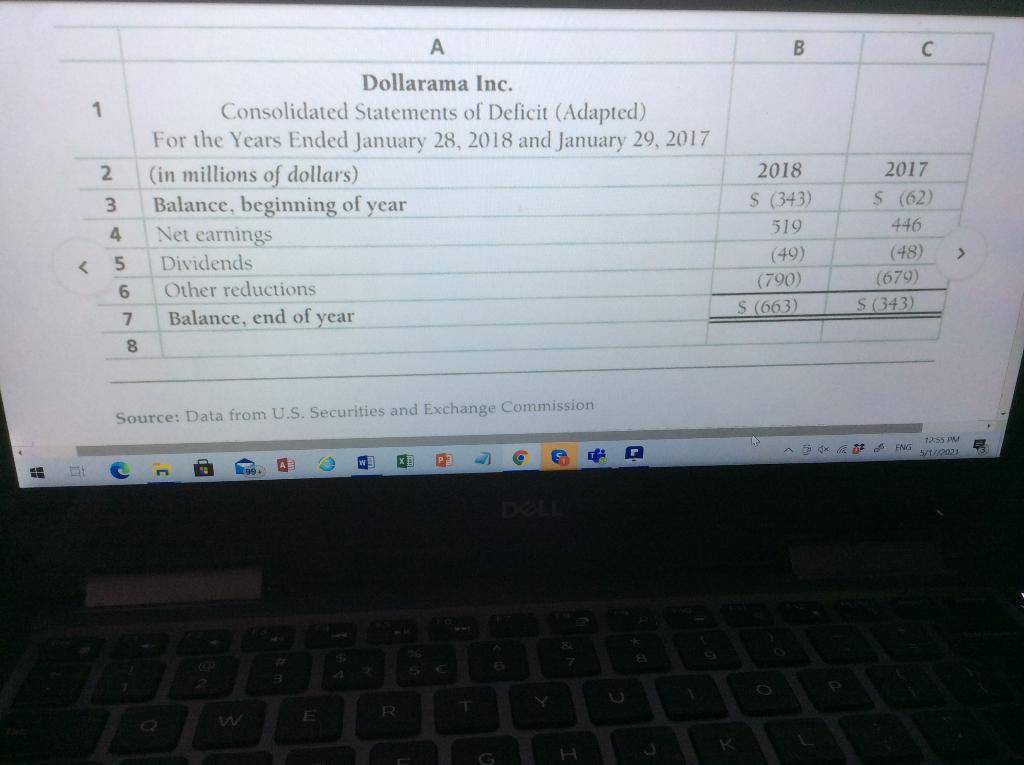
From the financial statement of Dollarama, please show the different ratios and calculations for years 2017 and 2018 of the following.
- Gross Profit Margin
- Inventory Turnover
- Net Working Capital
- Debt Ratio
- Current Ratio
- Quick Ratio (Acid Test)
- Average Accounts Receivables
- Accounts Receivables Turnover
- Days Sales in Receivables
- Return On Assets (ROA)
Show the Formula first and then apply the corrected figures and amounts to the formula.
Find the ratios for both years 2017 and 2018.
P.S. Please find above the Dollaramas Financial Statement attached. Net Earnings, Balance Sheet and Cash Flow.
Do not use Excel for this assignment.
A B Dollarama Inc. 1 Consolidated Statements of Net Earnings (Adapted) For the Years Ended January 28, 2018 and January 29, 2017 2 (in millions of dollars) 3 Sales 4. Cost of sales 5 Gross profit 6 General, administrative and store operating expenses 7 Depreciation and amortization Financing costs Earnings before income taxes 10 Income taxes 11 Net earnings 12 2018 $ 3,266,1 1,965.2 1.300.9 474.8 70.6 39.9 715,6 196.2 519.4 2017 $ 2.963.2 1.801.9 1.161.3 458.0 57.8 33.1 612.4 166.8 445.6 co 9 9 $ $ Dollarama's financial year (or fiscal year) ends on the Saturday closest to fanuary 31 each year, which is why its 2017 and 2018 year-end dates are different ING Auxit W x P 3 A B 1 2 2017 3 Dollarama Inc. Consolidated Statements of Deficit (Adapted) For the Years Ended January 28, 2018 and January 29, 2017 (in millions of dollars) Balance, beginning of year Net earnings Dividends Other reductions Balance, end of year 4 2018 $ (343) 519 (49) (790) S (663) $ (62) 446 (48) (679) S (343) > S S 228.+ 12.2 198.5 11.6 * A ENG A C + 16 S $ 228.4 12.2 39,5 35.7 405,2 720.9 198,5 11.6 16.6 8.1 278.6 513.4 17 Current liabilities 18 Accounts payable and accrued liabilities 19 Dividend payable 20 Income taxes payable 21 Derivative financial instruments 22 Current portion of long-term debt 23 24 Non-current liabilities 25 Long-term debt 26 Deferred rent and lease inducements 27 Deferred income taxes 28 Total liabilities 29 30 Shareholders' equity (deficit) 31 Share capital 32 Contributed surplus 33 Deficit 34 Accumulated other comprehensive loss 35 Total shareholders' equity (deficit) 36 Total liabilities and shareholders' equity (deficit) 1.260.5 92.6 112.7 2,186.7 1,050.1 81.8 117.8 1.763,2 +20.3 24.3 (343.0 415.8 27.7 (66 3.+) (32. (252.4) $ 1,934,3 (1.3) 100.3 $ 1,863,5 ENG 37 w x P . 99 + C Consolidated Statements or Cash Flows Adapted) For the Years Ended January 28, 2018 and January 29, 2017 (in millions of dollars) 2 3 2018 2017 4 5 5104 S4656 6 Operating activities Nel carmines Adjustments to reconcile net camnings to net cash generated from operating activities: Depreciation and amortization Financing costs on long term debi Loss on disposal of assets Other reconciling items 7. 55.0 67.9 1.3 8 9 10 11 22.+ 6113 25.9 037.3 5088 0.0 505.2 Changes in non-cash working capital components Nel cash generated from operating activities 12 >
Step by Step Solution
There are 3 Steps involved in it
Step: 1

Get Instant Access to Expert-Tailored Solutions
See step-by-step solutions with expert insights and AI powered tools for academic success
Step: 2

Step: 3
Ace Your Homework with AI
Get the answers you need in no time with our AI-driven, step-by-step assistance
Get Started
Reforming The Governance Of The Financial Sector
Authors: David Mayes , Geoffrey Wood
1st Edition
0415686849, 978-0415686846