Answered step by step
Verified Expert Solution
Link Copied!

Question

1 Approved Answer

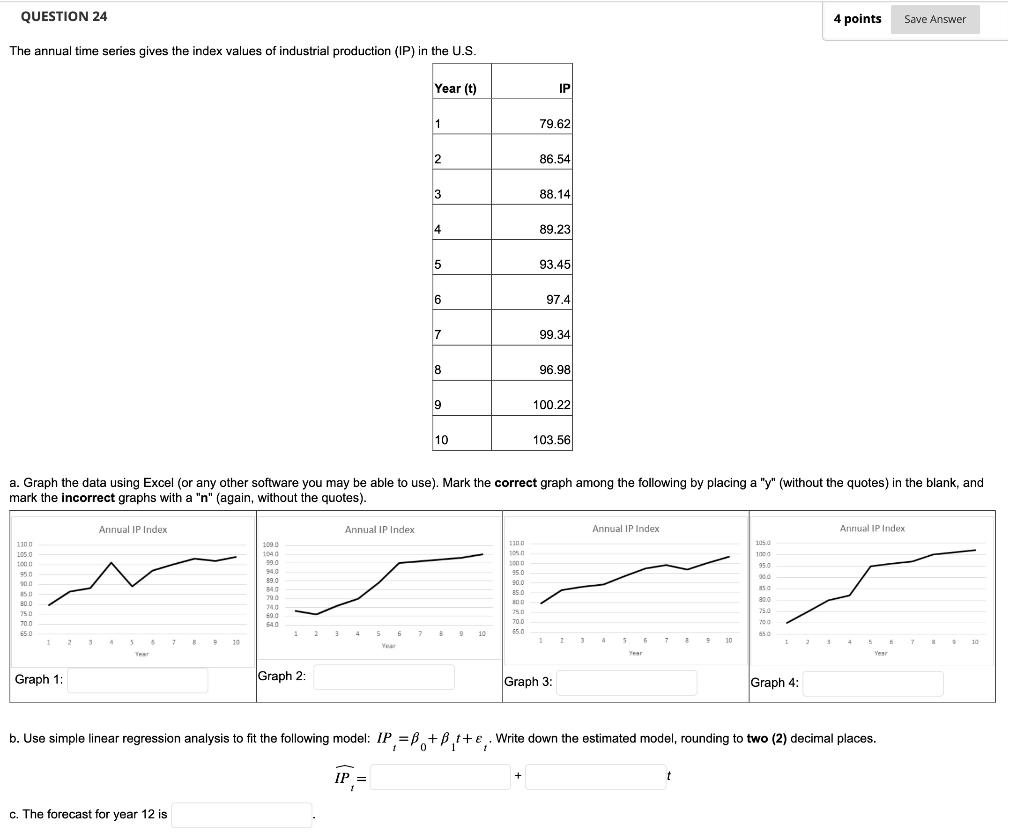
Please answer all. The annual time series gives the index values of industrial production (IP) in the U.S. a. Graph the data using Excel (or

Please answer all.

image text in transcribedimage text in transcribed

The annual time series gives the index values of industrial production (IP) in the U.S. a. Graph the data using Excel (or any other software you may be able to use). Mark the correct graph among the following by placing a "y" (without the quotes) in the blank, and mark the incorrect graphs with a " n " (again, without the quotes). Graph 2: Graph 3: Graph 4: b. Use simple linear regression analysis to fit the following model: IPt=0+1t+t. Write down the estimated model, rounding to two (2) decimal places. The following linear trend expression was estimated using a time series with 17 time periods (that is, the values of t are 1,2,,17 ). yt=129.2+3.8t Calculate a 95% prediction interval for the value of Y at time period t=18 (i.e., h=1 period ahead). Use the fact that the average of the time values is x=9, the standard deviation of the time values is sX=5.05, and the regression standard error se=0.841. Take all calculations and the final answer to three (3) decimal places. Lower Bound = Upper Bound = The annual time series gives the index values of industrial production (IP) in the U.S. a. Graph the data using Excel (or any other software you may be able to use). Mark the correct graph among the following by placing a "y" (without the quotes) in the blank, and mark the incorrect graphs with a " n " (again, without the quotes). Graph 2: Graph 3: Graph 4: b. Use simple linear regression analysis to fit the following model: IPt=0+1t+t. Write down the estimated model, rounding to two (2) decimal places. The following linear trend expression was estimated using a time series with 17 time periods (that is, the values of t are 1,2,,17 ). yt=129.2+3.8t Calculate a 95% prediction interval for the value of Y at time period t=18 (i.e., h=1 period ahead). Use the fact that the average of the time values is x=9, the standard deviation of the time values is sX=5.05, and the regression standard error se=0.841. Take all calculations and the final answer to three (3) decimal places. Lower Bound = Upper Bound =

Step by Step Solution

There are 3 Steps involved in it

Step: 1

blur-text-image

Get Instant Access to Expert-Tailored Solutions

See step-by-step solutions with expert insights and AI powered tools for academic success

Step: 2

blur-text-image

Step: 3

blur-text-image

Ace Your Homework with AI

Get the answers you need in no time with our AI-driven, step-by-step assistance

Get Started

Recommended Textbook for

Internal Audit Emphasis Management In Organizations

Authors: Juarez Pinto, Anísio Cândido Pereira, Joshua Onome Imoniana

1st Edition

ISBN: 3659942332, 978-3659942334

More Books

Students also viewed these Accounting questions

Question

Choose an appropriate organizational pattern for your speech

Answered: 1 week ago

Question

Writing a Strong Conclusion

Answered: 1 week ago