

Answered step by step
Verified Expert Solution
Question
1 Approved Answer
please answer all the question thanks You must include all data in a worksheet to a chart. True False Question 14 (1 point) Axis titles
please answer all the question thanks 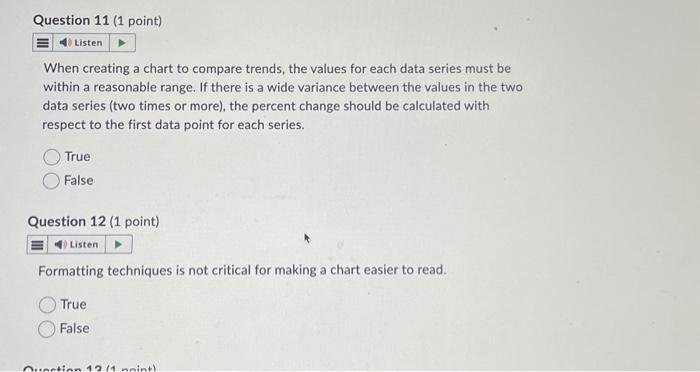
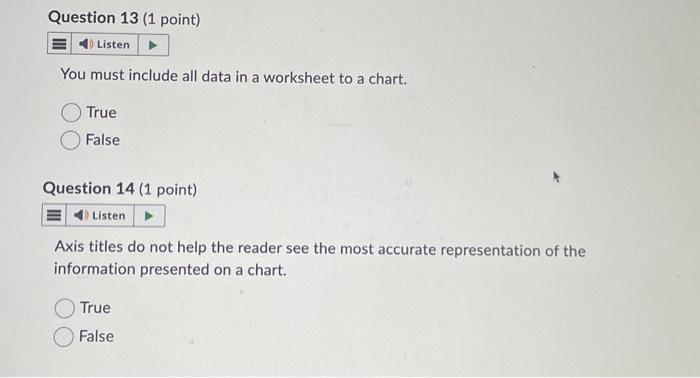
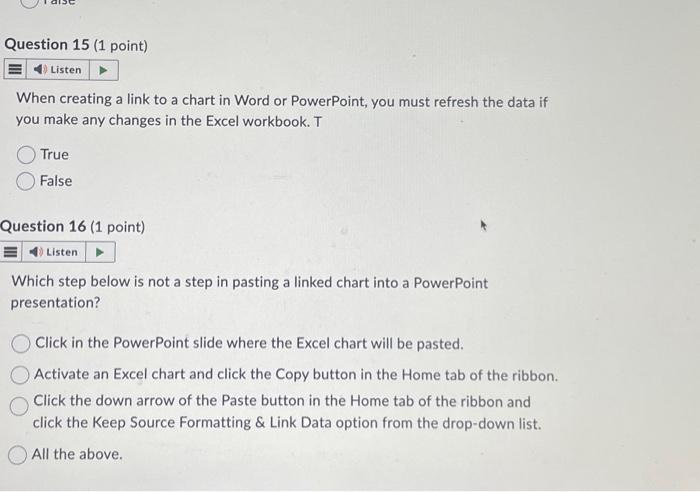
You must include all data in a worksheet to a chart. True False Question 14 (1 point) Axis titles do not help the reader see the most accurate representation of the information presented on a chart. True False When creating a link to a chart in Word or PowerPoint, you must refresh the data if you make any changes in the Excel workbook. T True False Question 16 ( 1 point) Which step below is not a step in pasting a linked chart into a PowerPoint presentation? Click in the PowerPoint slide where the Excel chart will be pasted. Activate an Excel chart and click the Copy button in the Home tab of the ribbon. Click the down arrow of the Paste button in the Home tab of the ribbon and click the Keep Source Formatting \& Link Data option from the drop-down list. All the above. When creating a chart to compare trends, the values for each data series must be within a reasonable range. If there is a wide variance between the values in the two data series (two times or more), the percent change should be calculated with respect to the first data point for each series. True False Question 12 (1 point) Formatting techniques is not critical for making a chart easier to read. True False Step by Step Solution
There are 3 Steps involved in it
Step: 1

Get Instant Access to Expert-Tailored Solutions
See step-by-step solutions with expert insights and AI powered tools for academic success
Step: 2

Step: 3
Ace Your Homework with AI
Get the answers you need in no time with our AI-driven, step-by-step assistance
Get Started
Mindful Brand Auditing The New Way To Explore Brand Value
Authors: Kurt Gassner
1st Edition
3987939176, 978-3987939174