PLEASE ANSWER ALL THE QUESTIONS
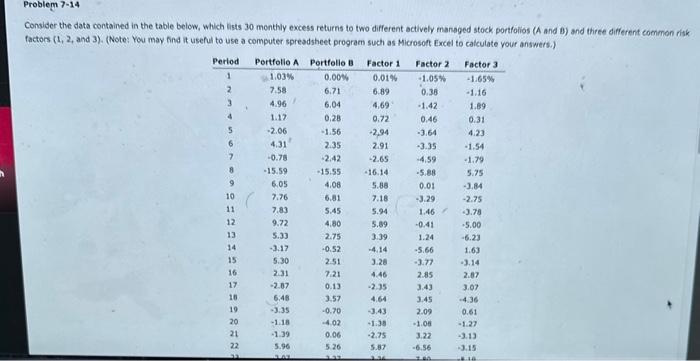
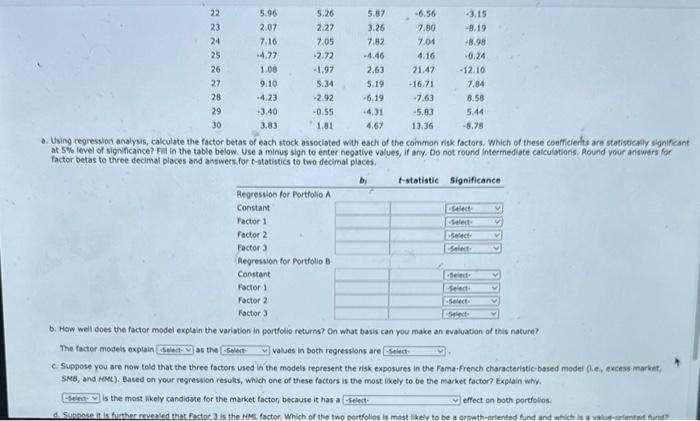
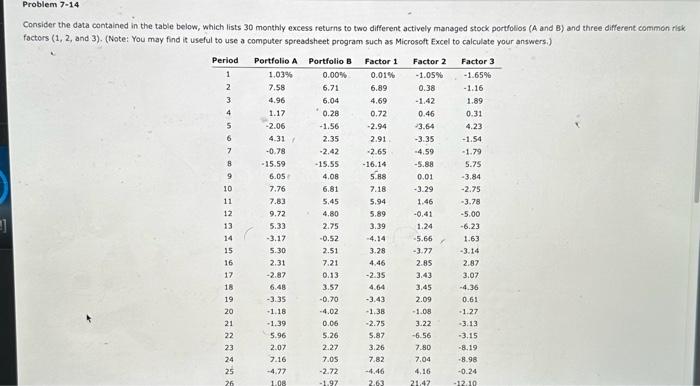
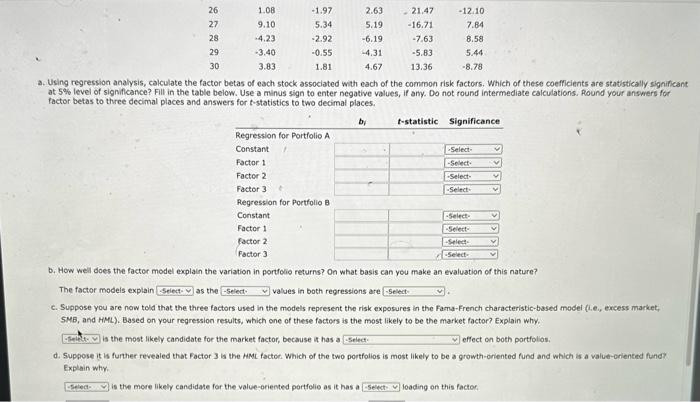
Consider the data contained in the table below, which lists 30 monthly excess returns to two different actively managed stock portfolios (A and 8 ) and thiree different common risk factors (1,2, and 3). (Note: You may find it useful to use a computer spresdsheet program such as Microsoft Excel to calculate your answers.) a. Using regression analysis, calculate the factor betas of each stock associated with each of the common risk foctors. Which of these coefficierts are statistically signifeant at 5% level of signincance? Fil in the table below. Use a minus sign to enter negative values, if any. Do not round intermediate calculations. Round vour ansieers for factor betas to three decimal places and answeer. for t-stathitics to two decimal places. b. How well does the factor model explain the variation in portfolio returns? On what basis can you make an evaluation of this nature? The factor modeis explain as the values in both regressions are c. Suppose you are now told that the three factors used in the models represent the risk exposures in the Fama-french characteriatic-bssed model (l.e., excess market, SME, and HML). Based on your regresion resuls, which one of these factors is the most likely to be the market factor? Explain why. is the most likely candidate for the market factor, because it has a effect on both portfolios: b. How well does the factor model explain the variation in portfollo returns? On what basis can you make an evaluation of this nature? The factor modests explain as the values in both regressions are c. Suppose you are now told that the three factors used in the models represent the risk exposures in the Fama-french characteristic-based model (i. e., excess market, 5MB, and HML). Based on your regression results, which one of these factors is the most likely to be the market factor? Explain why. is the most likely candidate for the manket factor, because it has a effect on both portfollos. d. Suppose it is further revesied that Factor 3 is the HML factor. Which of the two portfolios is most likely to be a growth-oriented fund and which is a value-oriented had? Explain why. is the more likely candidate for the value-oriented portfolio as it has a loading on this factor. is the more likely candidate for the gromth-oriented portfolio as it has a loading on this foctor, Consider the data contained in the table below, which lists 30 monthly excess returns to two different actively managed stock portfolios (A and B) and three different common risk) factors (1, 2, and 3). (Note: You may find is useful to use a computer spreadsheet program such as Microsoft Excel to calculate your answers.) a. Using regression analysis, calculate the factor betas of each stock assoclated with each of the common risk factors. Which of these coefficients are statistically significant at 5% level of signiffcance? Fill in the table below. Use a minus sign to enter negative values, if any. Do not round intermediate calculations. Rlound your answers for factor betas to three decimal places and answers for t-statistics to two decimal places. b. How well does the factor model explain the variation in portfolio returns? On what basis can you make an evaluation of this nature? The factor models explain as the values in both regressions are c. Suppose you are now told that the three factors used in the models represent the risk exposures in the Fama-French characteristic-based model (i.e., excess market, SMB, and MML). Based on your regression results, which one of these factors is the most likely to be the market factor? Explain why. is the most likeiy candidate for the market factor, because it has a effect on both portfolios. d. Suppose it is further revealed that Factor 3 is the HMt factoc. Which of the two portfolios is most likely to be a growth-oriented fund and which is a value-criented fund? Explain why. is the more likely candidate for the value-ofiented portfolie as it has a loading on this factor. at 5% level of significance? Fill in the table below. Use a minus sign to enter negative values, If any, Do not round intermediate calculations. Round your answers factor betas to three decimal places and answers for t-statistics to two decimal places. b. How well does the factor model explain the variation in portfosis returns? On what basis can you make an evaluation of this nature? The factor models explain as the values in both regressions are c. Suppose you are now told that the three factors used in the models represent the risk exposures in the fama. French characteristic-based model (l.A., excess market SMEB, and HML), Based on yeur regresion results, which one of these factors is the most tikely to be the market factor? Explain why. is the most likely candidate for the market factor, because it has a effect on both portfolios. d. Suppose it is further revenind that factor 3 is the HMC factor. Which of the two portlalios is most whely to be a growth-oriented fund and which is a value-oriented fun Explain why. is the more likely candidete for the value-enented portlols as it has a loading on this factor. is the more Fkely candidate for the growth-oriented portfolio as it has a lasding on this factor. Consider the data contained in the table below, which lists 30 monthly excess returns to two different actively managed stock portfolios (A and 8 ) and thiree different common risk factors (1,2, and 3). (Note: You may find it useful to use a computer spresdsheet program such as Microsoft Excel to calculate your answers.) a. Using regression analysis, calculate the factor betas of each stock associated with each of the common risk foctors. Which of these coefficierts are statistically signifeant at 5% level of signincance? Fil in the table below. Use a minus sign to enter negative values, if any. Do not round intermediate calculations. Round vour ansieers for factor betas to three decimal places and answeer. for t-stathitics to two decimal places. b. How well does the factor model explain the variation in portfolio returns? On what basis can you make an evaluation of this nature? The factor modeis explain as the values in both regressions are c. Suppose you are now told that the three factors used in the models represent the risk exposures in the Fama-french characteriatic-bssed model (l.e., excess market, SME, and HML). Based on your regresion resuls, which one of these factors is the most likely to be the market factor? Explain why. is the most likely candidate for the market factor, because it has a effect on both portfolios: b. How well does the factor model explain the variation in portfollo returns? On what basis can you make an evaluation of this nature? The factor modests explain as the values in both regressions are c. Suppose you are now told that the three factors used in the models represent the risk exposures in the Fama-french characteristic-based model (i. e., excess market, 5MB, and HML). Based on your regression results, which one of these factors is the most likely to be the market factor? Explain why. is the most likely candidate for the manket factor, because it has a effect on both portfollos. d. Suppose it is further revesied that Factor 3 is the HML factor. Which of the two portfolios is most likely to be a growth-oriented fund and which is a value-oriented had? Explain why. is the more likely candidate for the value-oriented portfolio as it has a loading on this factor. is the more likely candidate for the gromth-oriented portfolio as it has a loading on this foctor, Consider the data contained in the table below, which lists 30 monthly excess returns to two different actively managed stock portfolios (A and B) and three different common risk) factors (1, 2, and 3). (Note: You may find is useful to use a computer spreadsheet program such as Microsoft Excel to calculate your answers.) a. Using regression analysis, calculate the factor betas of each stock assoclated with each of the common risk factors. Which of these coefficients are statistically significant at 5% level of signiffcance? Fill in the table below. Use a minus sign to enter negative values, if any. Do not round intermediate calculations. Rlound your answers for factor betas to three decimal places and answers for t-statistics to two decimal places. b. How well does the factor model explain the variation in portfolio returns? On what basis can you make an evaluation of this nature? The factor models explain as the values in both regressions are c. Suppose you are now told that the three factors used in the models represent the risk exposures in the Fama-French characteristic-based model (i.e., excess market, SMB, and MML). Based on your regression results, which one of these factors is the most likely to be the market factor? Explain why. is the most likeiy candidate for the market factor, because it has a effect on both portfolios. d. Suppose it is further revealed that Factor 3 is the HMt factoc. Which of the two portfolios is most likely to be a growth-oriented fund and which is a value-criented fund? Explain why. is the more likely candidate for the value-ofiented portfolie as it has a loading on this factor. at 5% level of significance? Fill in the table below. Use a minus sign to enter negative values, If any, Do not round intermediate calculations. Round your answers factor betas to three decimal places and answers for t-statistics to two decimal places. b. How well does the factor model explain the variation in portfosis returns? On what basis can you make an evaluation of this nature? The factor models explain as the values in both regressions are c. Suppose you are now told that the three factors used in the models represent the risk exposures in the fama. French characteristic-based model (l.A., excess market SMEB, and HML), Based on yeur regresion results, which one of these factors is the most tikely to be the market factor? Explain why. is the most likely candidate for the market factor, because it has a effect on both portfolios. d. Suppose it is further revenind that factor 3 is the HMC factor. Which of the two portlalios is most whely to be a growth-oriented fund and which is a value-oriented fun Explain why. is the more likely candidete for the value-enented portlols as it has a loading on this factor. is the more Fkely candidate for the growth-oriented portfolio as it has a lasding on this factor