Please answer Analysis #2 and #4. Also, please explain why the % difference is not within 0.2% in #2. E.g. If I: = 119.36 s,
Please answer Analysis #2 and #4. Also, please explain why the % difference is not within 0.2% in #2.
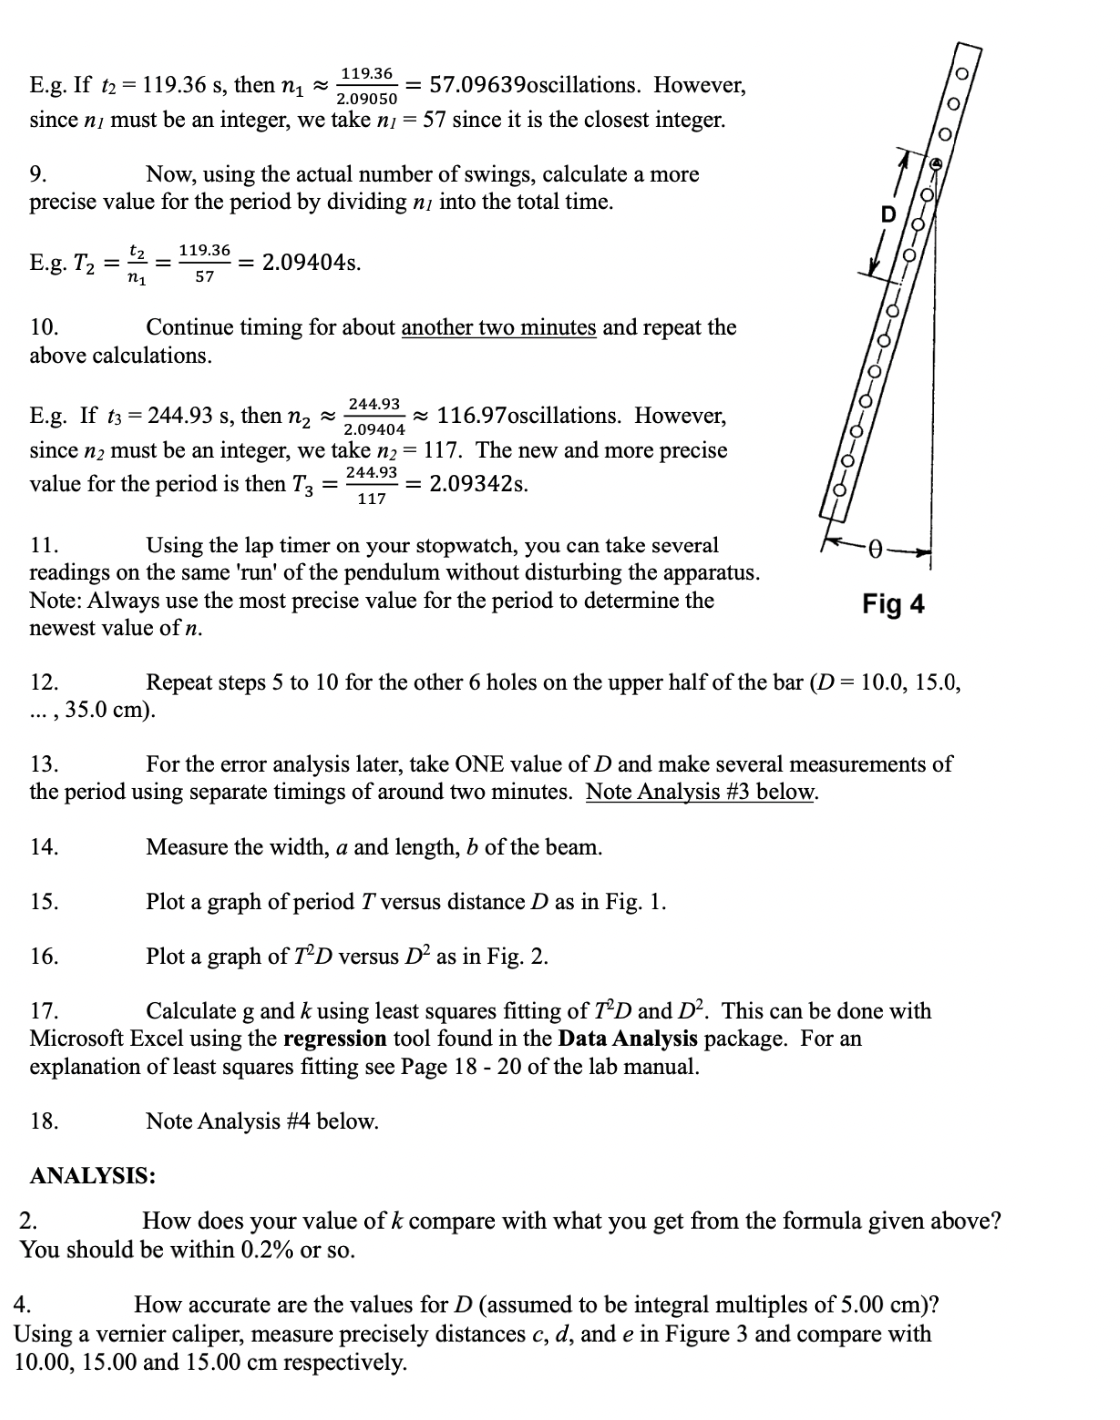
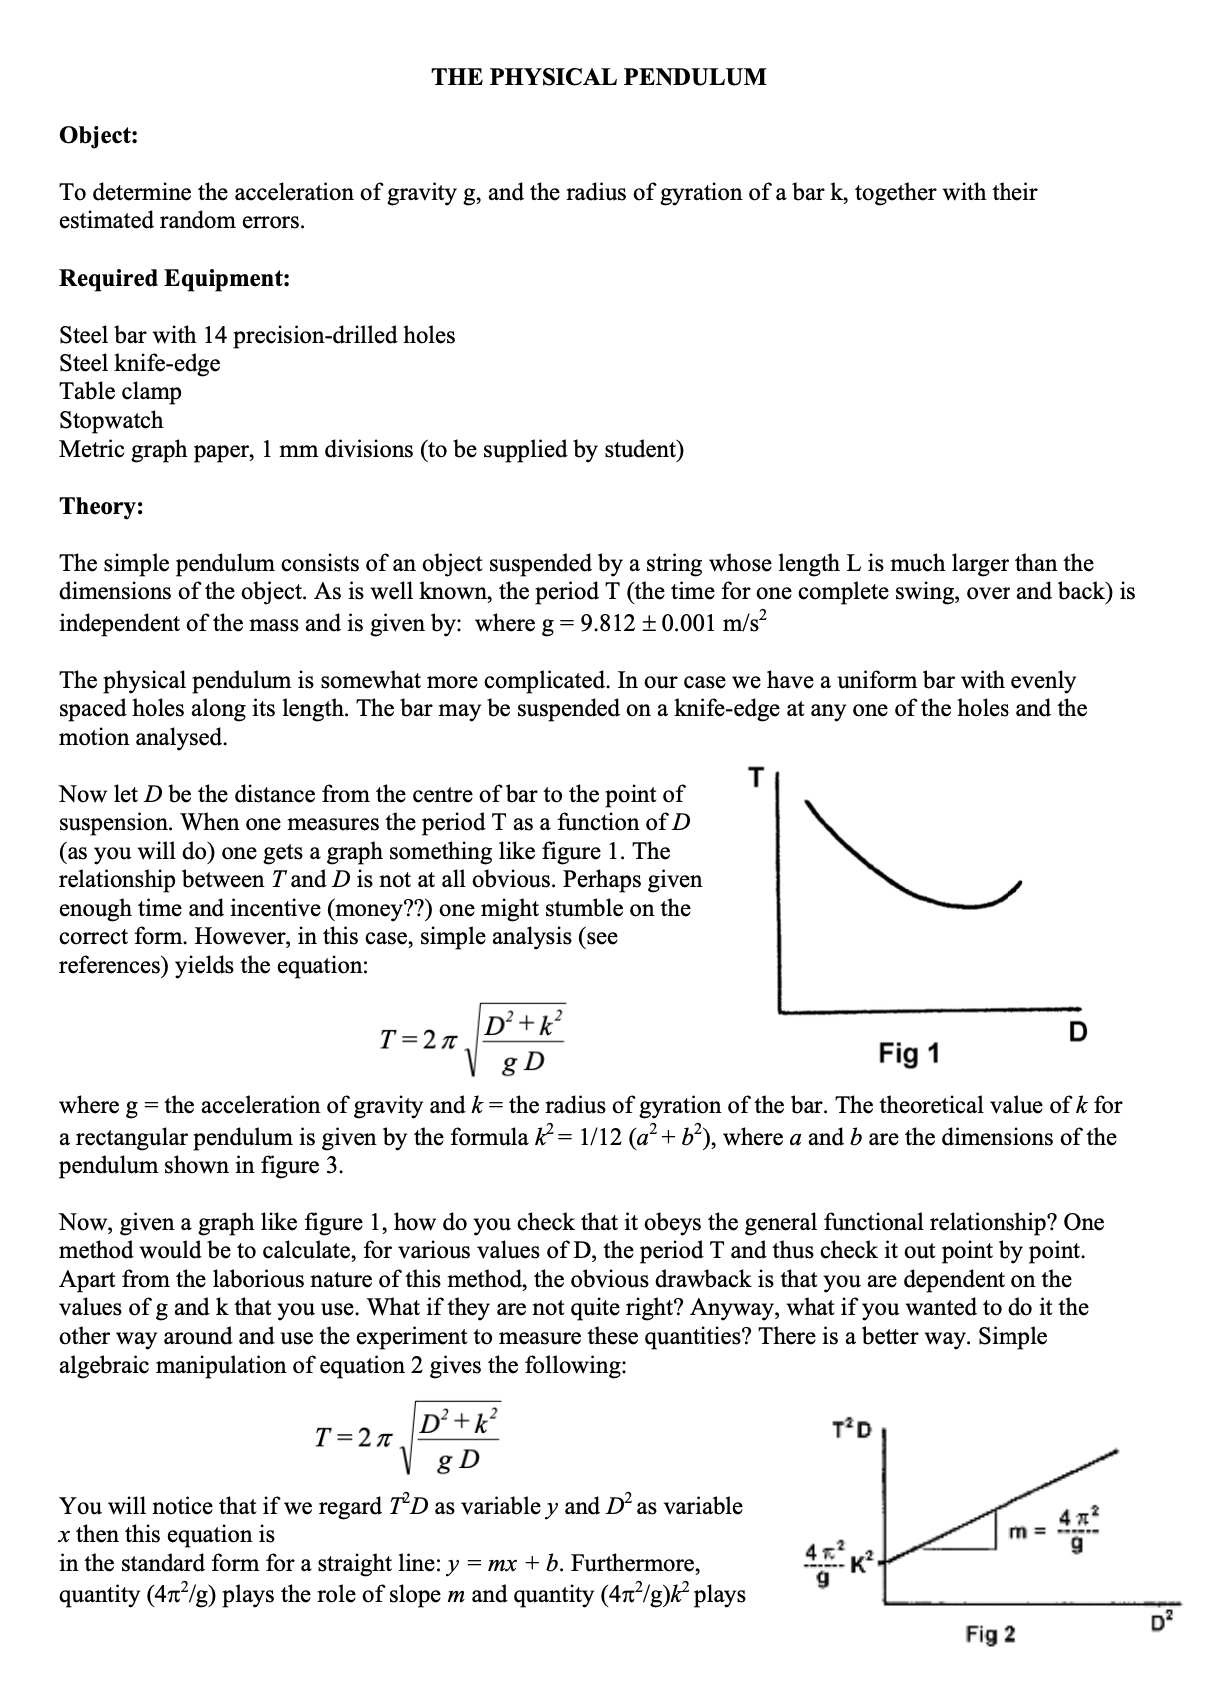
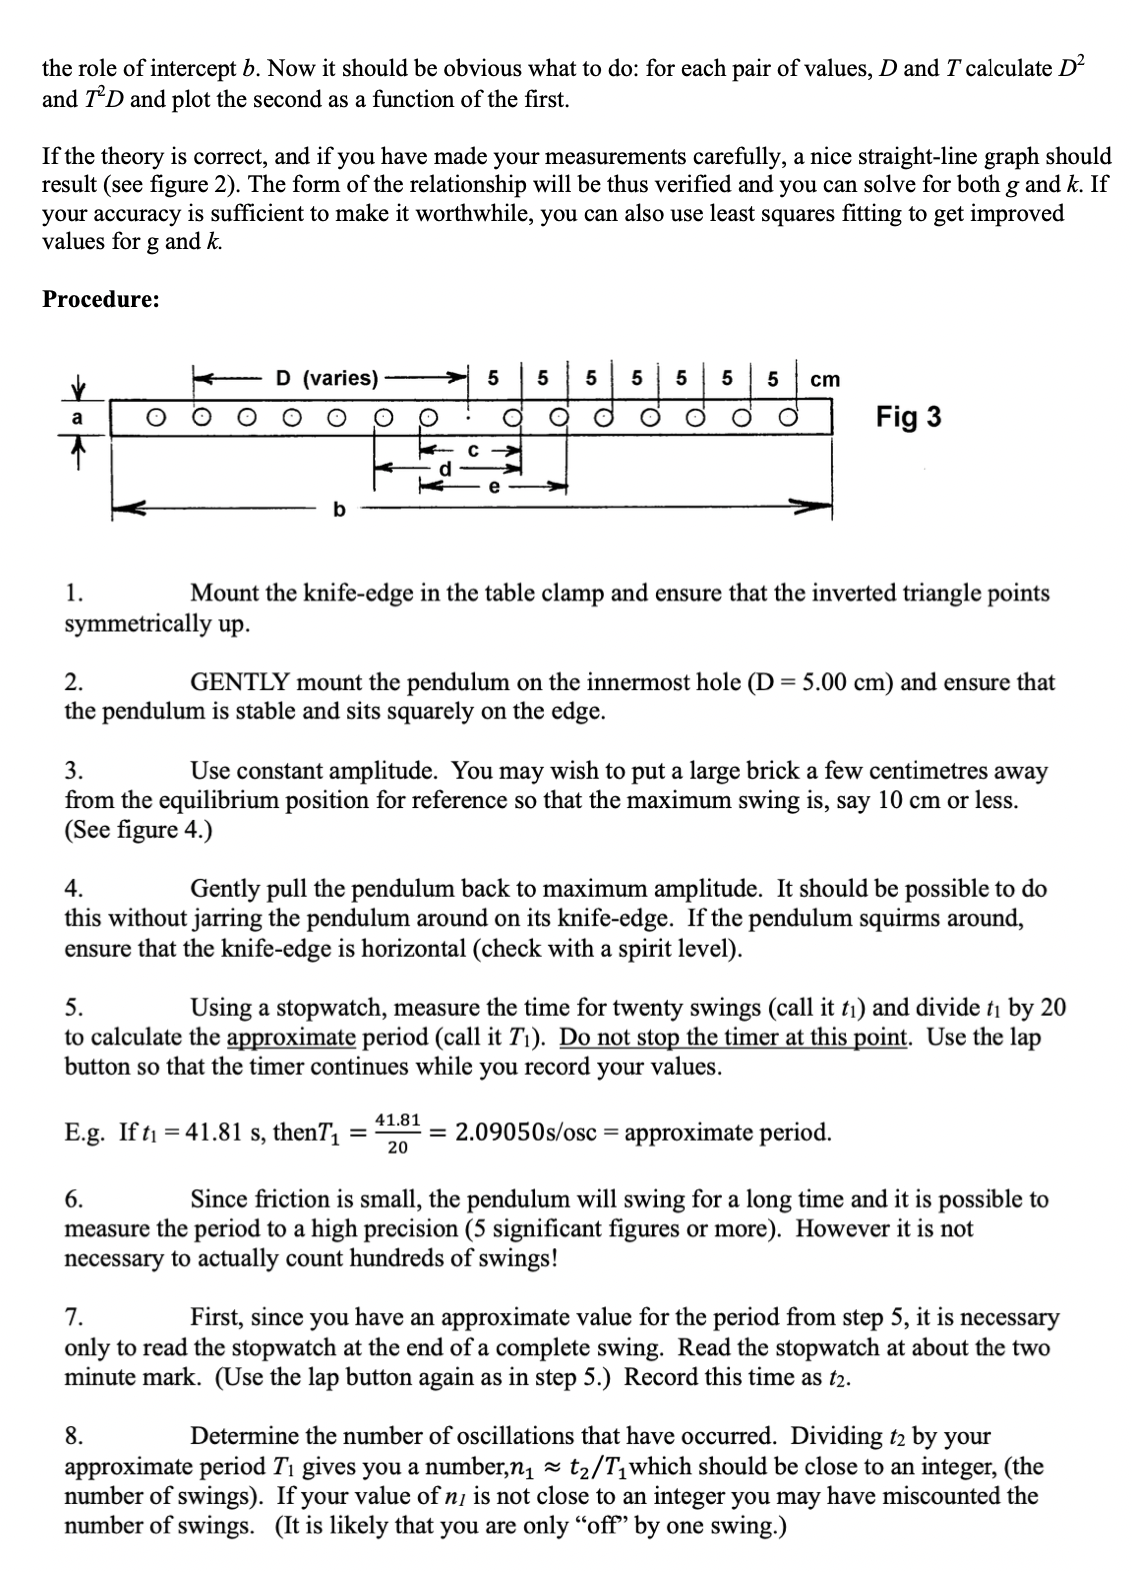
E.g. If I: = 119.36 s, then 111 3 213363560 = 57.09639050illati0ns. However, since m must be an integer, we take m = 57 since it is the closest integer. 9. Now, using the actual number of swings, calculate a more precise value for the period by dividing it; into the total time. _ 119.36 E. g T2: t2 = 2.094045. \"1 10. Continue timing for about another two minutes and repeat the above calculations. 244. 93 #1 16. 97oscillations. However, E. g. If {3 244.93 s, then 112309404 since a; must be an integer, we tazke 1132117. The new and more precise 24'4\" _ 2.093425. 11? value for the period 15 then T l 1. Using the lap timer on your stopwatch, you can take several readings on the same 'run' of the pendulum without disturbing the apparatus. Note: Always use the most precise value for the period to determine the Fig 4 newest value of n. 12. Repeat steps 5 to 10 for the other 6 holes on the upper half of the bar (D = 10.0, 15.0, . , 35.0 cm). 13. For the error analysis later, take ONE value of D and make several measurements of the period using separate timings of around two minutes. Note Analysis #3 below. 14. Measure the width, 0 and length, 3.1 of the beam. 15. Plot a graph of period 1" versus distance D as in Fig. 1. l6. Plot a graph of T2D versus D2 as in Fig. 2. 1?. Calculate g and I: using least squares tting of T21) and DZ. This can be done with Microsoft Excel using the regression tool found in the Data Analysis package. For an explanation of least squares tting see Page 18 - 20 of the lab manual. 18. Note Analysis #4 below. ANALYSIS: 2. How does your value of I: compare with what you get from the formula given above? You should be within 0.2% or so. 4. How accurate are the values for D {assumed to be integral multiples of 5.00 cm)? Using a vernier caliper, measure precisely distances 0, d, and e in Figure 3 and compare with 10.00, 15.00 and 15.00 cm respectively. THE PHYSICAL PENDULUM Object: To determine the acceleration of gravity g, and the radius of gyration of a bar k, together with their estimated random errors. Required Equipment: Steel bar with 14 precisiondrilled holes Steel knife-edge Table clamp Stopwatch Metric graph paper, 1 mm divisions (to be supplied by student) Theory: The simple pendulum consists of an object suspended by a string whose length L is much larger than the dimensions of the object. As is well known, the period T (the time for one complete swing, over and back) is independent of the mass and is given by: where g = 9.812 1 0.001 rnz's2 The physical pendulum is somewhat more complicated. In our case we have a uniform bar with evenly spaced holes along its length. The bar may be suspended on a knife-edge at any one of the holes and the motion analysed. Now let D be the distance from the centre of bar to the point of T suspension. When one measures the period T as a function of D (as you will do) one gets a graph something like gure 1. The relationship between T and D is not at all obvious. Perhaps given enough time and incentive (money??) one might stumble on the correct form. However, in this case, simple analysis (see references) yields the equation: D2+k2 I D g0 Flg1 where g = the acceleration of gravity and k = the radius of gyration of the bar. The theoretical value of k for a rectangular pendulum is given by the formula k2 = 1/ 12 (a;)1 + .52), where a and b are the dimensions of the pendulum shown in gure 3. T=25 Now, given a graph like gure 1, how do you check that it obeys the general functional relationship? One method would be to calculate, for various values of D, the period T and thus check it out point by point. Apart from the laborious nature of this method, the obvious drawback is that you are dependent on the values of g and k that you use. What if they are not quite right? Anyway, what if you wanted to do it the other way around and use the experiment to measure these quantities? There is a better way. Simple algebraic manipulation of equation 2 gives the following: D2+kz T'D gD T=2 You will notice that if we regard TED as variable y and D2 as variable x then this equation is in the standard form for a straight line: y : mx + 45. Furthermore, ----- K2 quantity (411:2fg) plays the role of slope m and quantity (42fg)k2 plays Fig 2 the role of intercept I). Now it should be obvious what to do: for each pair of values, D and T calculate if)2 and 72D and plot the second as a function of the rst. If the theory is correct, and if you have made your measurements carefully, a nice straight-line graph should result (see gure 2). The form of the relationship will be thus veried and you can solve for both g and k. If your accuracy is sufcient to make it worthwhile, you can also use least squares tting to get improved values for g and k. Procedure: D (varies) 1. Mount the knifeedge in the table clamp and ensure that the inverted triangle points symmetrically up. 2. GENTLY mount the pendulum on the innermost hole (D = 5.00 cm) and ensure that the pendulum is stable and sits squarely on the edge. 3. Use constant amplitude. You may wish to put a large brick a few centimetres away from the equilibrium position for reference so that the maximum swing is, say 10 cm or less. (See gure 4.) 4. Gently pull the pendulum back to maximum amplitude. It should be possible to do this without jarring the pendulum around on its knife-edge. If the pendulum squirms around, ensure that the knife-edge is horizontal (check with a spirit level). 5. Using a stopwatch, measure the time for twenty swings (call it t1) and divide n by 20 to calculate the approximate period (call it T1). Do not stop the timer at this point. Use the lap button so that the timer continues while you record your values. E g. If t] 41. 81 s, thenT1 = % 2.090505/osc = approximate period. 6. Since friction is small, the pendulum will swing for a long time and it is possible to measure the period to a high precision {5 signicant gures or more). However it is not necessary to actually count hundreds of swings! 7. First, since you have an approximate value for the period from step 5, it is necessary only to read the stopwatch at the end of a complete swing. Read the stopwatch at about the two minute mark. (Use the lap button again as in step 5.) Record this time as $2. 8. Determine the number of oscillations that have occurred. Dividing I: by your approximate period T1 gives you a numberml a: t2 /T1 which should be close to an integer, (the number of swings). If your value of m is not close to an integer you may have miscounted the number of swings. (It is likely that you are only \"off\" by one swing.)
Step by Step Solution
There are 3 Steps involved in it
Step: 1
Get Instant Access to Expert-Tailored Solutions
See step-by-step solutions with expert insights and AI powered tools for academic success
Step: 2
Step: 3
Ace Your Homework with AI
Get the answers you need in no time with our AI-driven, step-by-step assistance