Answered step by step
Verified Expert Solution
Question
1 Approved Answer
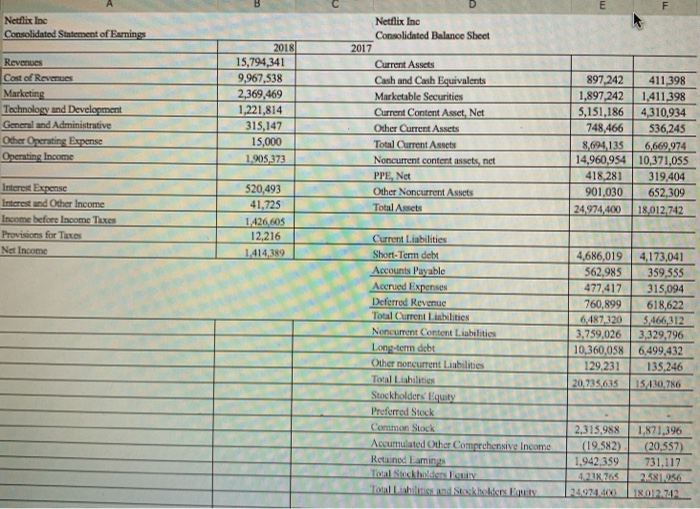
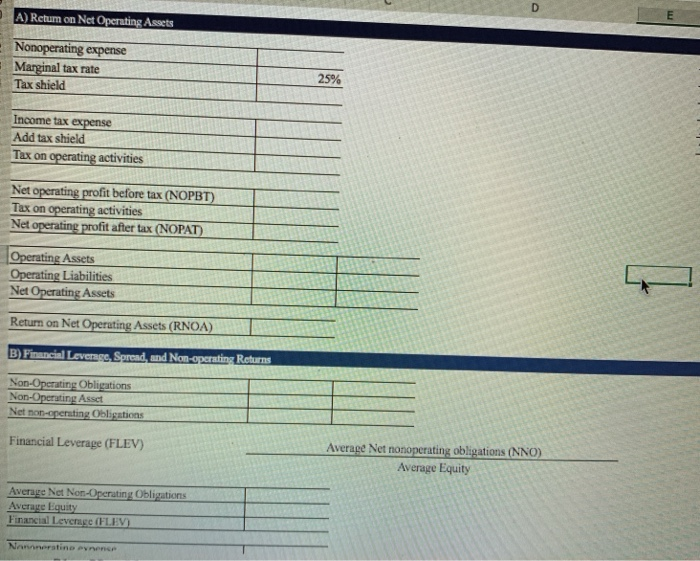
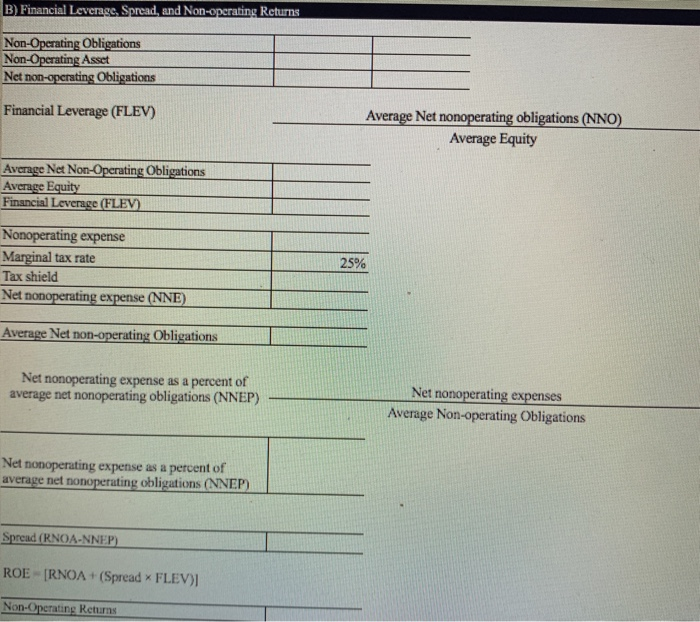
Please answer and include calculations if possible. will give thumbs up!! fill in the blanks E F Netflix Inc Consolidated Statement of Earnings Revenues Cost
Please answer and include calculations if possible. will give thumbs up!!  fill in the blanks

E F Netflix Inc Consolidated Statement of Earnings Revenues Cost of Revenues Marketing Technology and Development General and Administrative Other Operating Expense Operating Income 2018 15,794,341 9,967,538 2,369,469 1,221,814 315,147 15,000 1.905,373 Netflix Inc Consolidated Balance Sheet 2017 Current Assets Cash and Cash Equivalents Marketable Securities Current Content Asset, Net Other Current Assets Total Current Assets Noncurrent content assets, net PPE, Net Other Noncurrent Assets Total Assets 897.242 411,398 1,897242 1,411,398 5,151,186 4,310,934 748,466 536,245 8,694,135 6,669,974 14,960,954 10,371,055 418,281 319,404 901.030 652,309 24,974.400 18,012.742 Interest Expense Interest and Other Income Income before Income Taxes Provisions for Taxes Net Income 520,493 41,725 1.426,605 12,216 1,414,389 Current Liabilities Short-Term debt Accounts Payable Accred Expenses Deferred Revenue Total Current Liabilities Noncurrent Content Liabilities Long-term debt Other noncurrent Liabilities Total Liabilities Stockholders Equity Preferred Stock Common Stock Accumulated Other Comprehensive Income Retained Laming Ton Stockholms Tomabilis and Stecklekkers wat 4,686,019 4,173,041 562,985 359,555 477.417 315,094 760,899 618,622 6,487-320 5,466,312 3,759,026 3,329,796 10,360,058 6,499.432 129.231 135,246 20,735,015 15430.786 2,315,988 (19.582) 1,942,359 42765 28.024.4 1,871,396 (20,557) 731,117 2.26 18012742 D A) Rctum on Net Operating Assets Nonoperating expense Marginal tax rate Tax shield 25% Income tax expense Add tax shield Tax on operating activities Net operating profit before tax (NOPBT) Tax on operating activities Net operating profit after tax (NOPAT) Operating Assets Operating Liabilities Net Operating Assets Return on Net Operating Assets (RNOA) B Financial Leverase. Spread, and Non-operating Returns Non-Operating Obligations Non-Operating Asset Net non-operating Obligations Financial Leverage (FLEV) Average Net nonoperating obligations (NNO) Average Equity Average Net Non-Operating Obligations Average Equity Financial Leverage (FLEV Nanestino nonce B) Financial Leverage, Spread, and Non-operating Returns Non-Operating Obligations Non-Operating Asset Net non-operating Obligations Financial Leverage (FLEV) Average Net nonoperating obligations (NNO) Average Equity Average Net Non-Operating Obligations Average Equity Financial Leverage (FLEV) Nonoperating expense Marginal tax rate Tax shield Net nonoperating expense (NNE) 25% Average Net non-operating Obligations Net nonoperating expense as a percent of average net nonoperating obligations (NNEP) Net nonoperating expenses Average Non-operating Obligations Net nonoperating expense as a percent of average net nonoperating obligations (NNEP) Spread (RNOA-NNEP) ROERNOA+ (Spread * FLEV) Non-Operating Returns E F Netflix Inc Consolidated Statement of Earnings Revenues Cost of Revenues Marketing Technology and Development General and Administrative Other Operating Expense Operating Income 2018 15,794,341 9,967,538 2,369,469 1,221,814 315,147 15,000 1.905,373 Netflix Inc Consolidated Balance Sheet 2017 Current Assets Cash and Cash Equivalents Marketable Securities Current Content Asset, Net Other Current Assets Total Current Assets Noncurrent content assets, net PPE, Net Other Noncurrent Assets Total Assets 897.242 411,398 1,897242 1,411,398 5,151,186 4,310,934 748,466 536,245 8,694,135 6,669,974 14,960,954 10,371,055 418,281 319,404 901.030 652,309 24,974.400 18,012.742 Interest Expense Interest and Other Income Income before Income Taxes Provisions for Taxes Net Income 520,493 41,725 1.426,605 12,216 1,414,389 Current Liabilities Short-Term debt Accounts Payable Accred Expenses Deferred Revenue Total Current Liabilities Noncurrent Content Liabilities Long-term debt Other noncurrent Liabilities Total Liabilities Stockholders Equity Preferred Stock Common Stock Accumulated Other Comprehensive Income Retained Laming Ton Stockholms Tomabilis and Stecklekkers wat 4,686,019 4,173,041 562,985 359,555 477.417 315,094 760,899 618,622 6,487-320 5,466,312 3,759,026 3,329,796 10,360,058 6,499.432 129.231 135,246 20,735,015 15430.786 2,315,988 (19.582) 1,942,359 42765 28.024.4 1,871,396 (20,557) 731,117 2.26 18012742 D A) Rctum on Net Operating Assets Nonoperating expense Marginal tax rate Tax shield 25% Income tax expense Add tax shield Tax on operating activities Net operating profit before tax (NOPBT) Tax on operating activities Net operating profit after tax (NOPAT) Operating Assets Operating Liabilities Net Operating Assets Return on Net Operating Assets (RNOA) B Financial Leverase. Spread, and Non-operating Returns Non-Operating Obligations Non-Operating Asset Net non-operating Obligations Financial Leverage (FLEV) Average Net nonoperating obligations (NNO) Average Equity Average Net Non-Operating Obligations Average Equity Financial Leverage (FLEV Nanestino nonce B) Financial Leverage, Spread, and Non-operating Returns Non-Operating Obligations Non-Operating Asset Net non-operating Obligations Financial Leverage (FLEV) Average Net nonoperating obligations (NNO) Average Equity Average Net Non-Operating Obligations Average Equity Financial Leverage (FLEV) Nonoperating expense Marginal tax rate Tax shield Net nonoperating expense (NNE) 25% Average Net non-operating Obligations Net nonoperating expense as a percent of average net nonoperating obligations (NNEP) Net nonoperating expenses Average Non-operating Obligations Net nonoperating expense as a percent of average net nonoperating obligations (NNEP) Spread (RNOA-NNEP) ROERNOA+ (Spread * FLEV) Non-Operating Returns  fill in the blanks

Step by Step Solution
There are 3 Steps involved in it
Step: 1

Get Instant Access to Expert-Tailored Solutions
See step-by-step solutions with expert insights and AI powered tools for academic success
Step: 2

Step: 3

Ace Your Homework with AI
Get the answers you need in no time with our AI-driven, step-by-step assistance
Get Started


