Please answer as soon as possible with explanations. Thanks
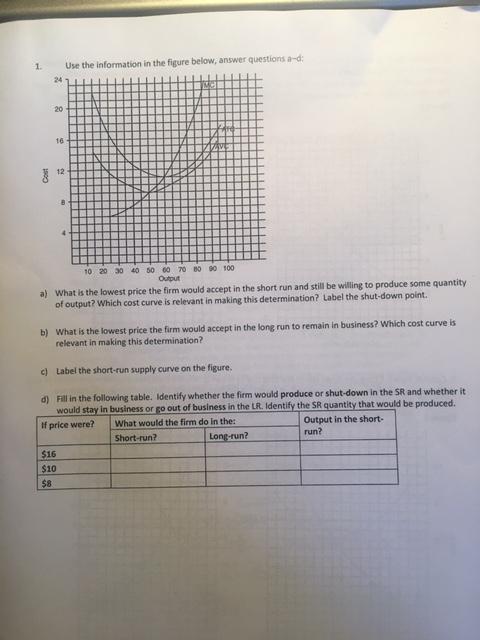
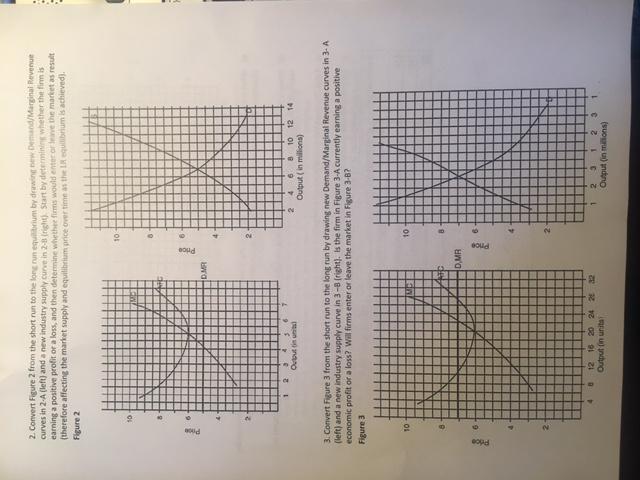
1 Use the information in the figure below, answer questions adi 24 20 10 4 10 20 30 40 50 60 70 80 90 100 Output a) What is the lowest price the firm would accept in the short run and still be willing to produce some quantity of output? Which cost curve is relevant in making this determination? Label the shut-down point. b) What is the lowest price the firm would accept in the long run to remain in business? Which cost curve is relevant in making this determination? label the short-run supply curve on the figure. d) Fill in the following table. Identify whether the firm would produce or shut-down in the SR and whether it would stay in business or go out of business in the LR. Identify the SR quantity that would be produced. price were? What would the firm do in the Output in the short- Short-run? Long-run? run? $16 $10 $8 2. Convert Figure 2 from the short run to the long run equilibrium by dewinnwand/Marginal Revenue curves in 2.A (left) and a new industry supply curve in 2-3 right). Start by determine whether the fimis earning a positive profit or a loss, and then determine whethems would enter are the market as result (therefore affecting the market supply and equilibrium price over time as the equilibrium is achieved). Figure 2 10 10 6 2 DMR 2 1 2 3 Output 36 2 4 6 8 10 12 14 Output (in millions) 3. Convert Figure 3 from the short run to the long run by drawing new Demand/Marginal Revenue curves in 3- A (left) and a new industry supply curve in 3-8 (right). Is the firm in Figure 3-A currently earning a positive economic profit or a loss? Will firms enter or leave the market in Figure 3-B2 Figure 3 10 Me 10 DMR Price 4 12 16 20 24 25 Outut in unita 1 2 3 1 2 3 Output on millions) 1 1 Use the information in the figure below, answer questions adi 24 20 10 4 10 20 30 40 50 60 70 80 90 100 Output a) What is the lowest price the firm would accept in the short run and still be willing to produce some quantity of output? Which cost curve is relevant in making this determination? Label the shut-down point. b) What is the lowest price the firm would accept in the long run to remain in business? Which cost curve is relevant in making this determination? label the short-run supply curve on the figure. d) Fill in the following table. Identify whether the firm would produce or shut-down in the SR and whether it would stay in business or go out of business in the LR. Identify the SR quantity that would be produced. price were? What would the firm do in the Output in the short- Short-run? Long-run? run? $16 $10 $8 2. Convert Figure 2 from the short run to the long run equilibrium by dewinnwand/Marginal Revenue curves in 2.A (left) and a new industry supply curve in 2-3 right). Start by determine whether the fimis earning a positive profit or a loss, and then determine whethems would enter are the market as result (therefore affecting the market supply and equilibrium price over time as the equilibrium is achieved). Figure 2 10 10 6 2 DMR 2 1 2 3 Output 36 2 4 6 8 10 12 14 Output (in millions) 3. Convert Figure 3 from the short run to the long run by drawing new Demand/Marginal Revenue curves in 3- A (left) and a new industry supply curve in 3-8 (right). Is the firm in Figure 3-A currently earning a positive economic profit or a loss? Will firms enter or leave the market in Figure 3-B2 Figure 3 10 Me 10 DMR Price 4 12 16 20 24 25 Outut in unita 1 2 3 1 2 3 Output on millions) 1