 PLEASE ANSWER ASAP!!!! THANK YOU AND ON PAPAER POLEASE
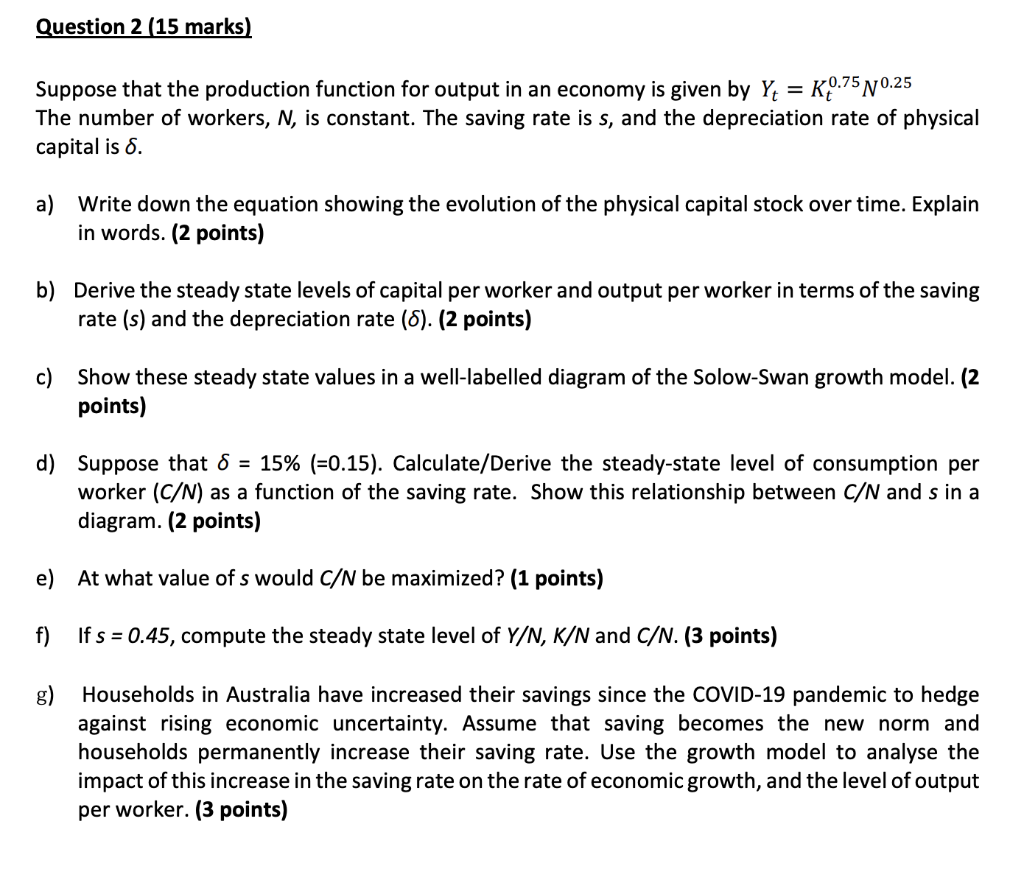
Question 2 (15 marks) Suppose that the production function for output in an economy is given by Yt=Kt0.75N0.25 The number of workers, N, is constant. The saving rate is s, and the depreciation rate of physical capital is . a) Write down the equation showing the evolution of the physical capital stock over time. Explain in words. (2 points) b) Derive the steady state levels of capital per worker and output per worker in terms of the saving rate (s) and the depreciation rate (). (2 points) c) Show these steady state values in a well-labelled diagram of the Solow-Swan growth model. (2 points) d) Suppose that =15%(=0.15). Calculate/Derive the steady-state level of consumption per worker (C/N) as a function of the saving rate. Show this relationship between C/N and s in a diagram. (2 points) e) At what value of s would C/N be maximized? (1 points) f) If s=0.45, compute the steady state level of Y/N,K/N and C/N. (3 points) g) Households in Australia have increased their savings since the COVID-19 pandemic to hedge against rising economic uncertainty. Assume that saving becomes the new norm and households permanently increase their saving rate. Use the growth model to analyse the impact of this increase in the saving rate on the rate of economic growth, and the level of output per worker. (3 points) Question 2 (15 marks) Suppose that the production function for output in an economy is given by Yt=Kt0.75N0.25 The number of workers, N, is constant. The saving rate is s, and the depreciation rate of physical capital is . a) Write down the equation showing the evolution of the physical capital stock over time. Explain in words. (2 points) b) Derive the steady state levels of capital per worker and output per worker in terms of the saving rate (s) and the depreciation rate (). (2 points) c) Show these steady state values in a well-labelled diagram of the Solow-Swan growth model. (2 points) d) Suppose that =15%(=0.15). Calculate/Derive the steady-state level of consumption per worker (C/N) as a function of the saving rate. Show this relationship between C/N and s in a diagram. (2 points) e) At what value of s would C/N be maximized? (1 points) f) If s=0.45, compute the steady state level of Y/N,K/N and C/N. (3 points) g) Households in Australia have increased their savings since the COVID-19 pandemic to hedge against rising economic uncertainty. Assume that saving becomes the new norm and households permanently increase their saving rate. Use the growth model to analyse the impact of this increase in the saving rate on the rate of economic growth, and the level of output per worker. (3 points)
 PLEASE ANSWER ASAP!!!! THANK YOU AND ON PAPAER POLEASE


