Answered step by step
Verified Expert Solution
Link Copied!

Question

1 Approved Answer

PLEASE ANSWER ASAP The figure provides data from the 1960s regarding the relationship between the unemployment rate and the inflation rate. MyLab Economics Concept Check
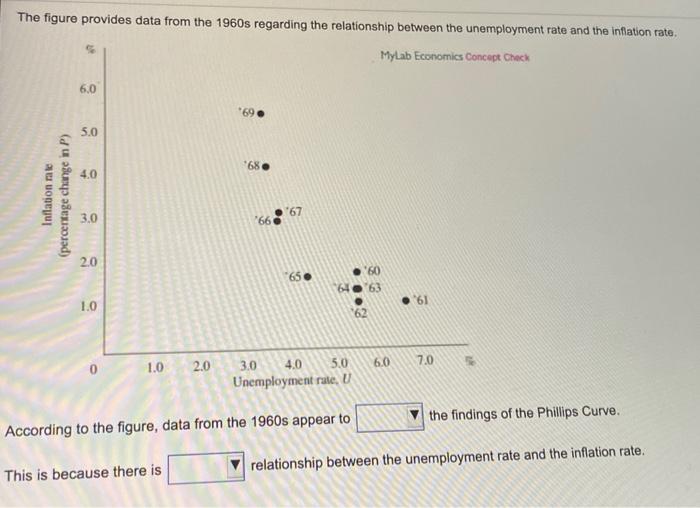
image text in transcribedPLEASE ANSWER ASAP
The figure provides data from the 1960s regarding the relationship between the unemployment rate and the inflation rate. MyLab Economics Concept Check 6.0 *69 5.0 '68 4,0 Inflation rate (percentage change in P) 3.0 2.0 *65 60 '63 61 1.0 62 1.0 2.0 60 7.0 3.0 4.0 5.0 Unemployment rate. U the findings of the Phillips Curve, According to the figure, data from the 1960s appear to relationship between the unemployment rate and the inflation rate. This is because there is

Step by Step Solution

There are 3 Steps involved in it

Step: 1

blur-text-image

Get Instant Access to Expert-Tailored Solutions

See step-by-step solutions with expert insights and AI powered tools for academic success

Step: 2

blur-text-image_2

Step: 3

blur-text-image_3

Ace Your Homework with AI

Get the answers you need in no time with our AI-driven, step-by-step assistance

Get Started

Recommended Textbook for

More Books

Students also viewed these Finance questions