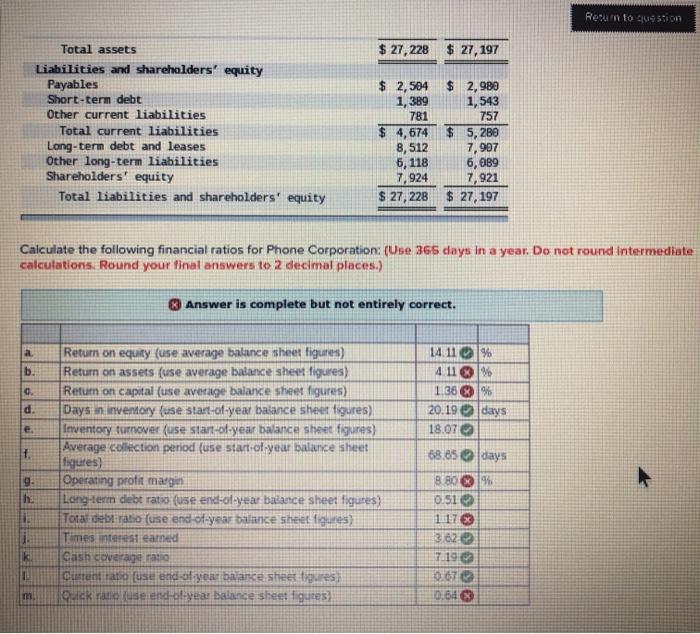
Please answer B, C, G, I, and M.
Calculate return on assets, return on capital, operating profit margin, total debt ratio, quick ratio. Thank you!!
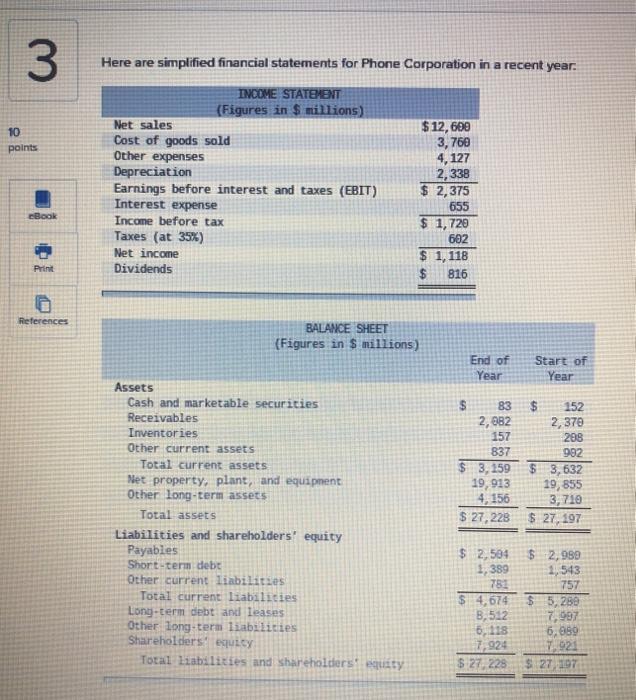
3 10 points Here are simplified financial statements for Phone Corporation in a recent year. INCOME STATEMENT (Figures in $ millions) Net sales $12,600 Cost of goods sold 3,760 Other expenses 4, 127 Depreciation 2,338 Earnings before interest and taxes (EBIT) $ 2,375 Interest expense 655 Income before tax $ 1,720 Taxes (at 35%) 602 Net income $ 1,118 Dividends $ 816 Book Print References BALANCE SHEET (Figures in $ millions) End of Year Start of Year $ 152 2,379 -288 982 Assets Cash and marketable securities Receivables Inventories Other current assets Total current assets Net property, plant, and equipment Other long-term assets Total assets Liabilities and shareholders' equity Payables Short-term debt Other current liabilities Total current liabilities Long-term debt and leases Other long-term liabilities Shareholders equity Total Liabilities and shareholders' equity $ 83 2,082 157 837 $ 3, 259 19,913 4, 156 $ 27, 228 $ 3,632 19,855 3, 710 $ 27, 197 $ 2,504 $ 2,989 1,389 2,543 781 757 $ 4,674 $ 5,280 B,512 7.997 6, 118 6,989 7,924 $ 27, 228 27 197 Return to custion $ 27, 228 $ 27, 197 Tatal assets Liabilities and shareholders' equity Payables Short-term debt Other current liabilities Total current liabilities Long-term debt and leases Other long-term liabilities Shareholders' equity Total liabilities and shareholders' equity $ 2,504 1,389 781 $ 4,674 8,512 6, 118 7,924 $ 27, 228 $ 2,980 1,543 757 $ 5,286 7,907 6,689 7,921 $ 27,197 Calculate the following financial ratios for Phone Corporation: (Use 365 days in a year. Do not round intermediate calculations. Round your final answers to 2 decimal places.) 3 Answer is complete but not entirely correct. a. b. 0 14.11% 4 11% 1.36 % 20.19 days 18.07 d. e. 1. Return on equity (use average balance sheet figures) Return on assets (use average balance sheet figures) Return on capital fuse average balance sheet figures) Days in inventory (use start-of-year balance sheet figures) Inventory tumover (use start-of-year balance sheet figures) Average collection period (use start-ofyear balance sheet fiqures) Operating profit margin Long-term debt ratio (use end-of-year balance sheet figures) Total debt ratio fuse end of year balance sheet figures) Times interesteamed Qash coverage ratio ustunt ratio (use end of year balance sheet figures) Quick rate use endalea: balance sheet ligures g. 68.65 days 8801 0.51 1173 362 7. 190 0.670 0.6483 K m