

Answered step by step
Verified Expert Solution
Question
1 Approved Answer
please answer both of them. thumps up later. thanks Spreadsheets are useful for computing statistics: averages, standard deviation, variance, and correlation are included as built-in
please answer both of them. thumps up later. thanks 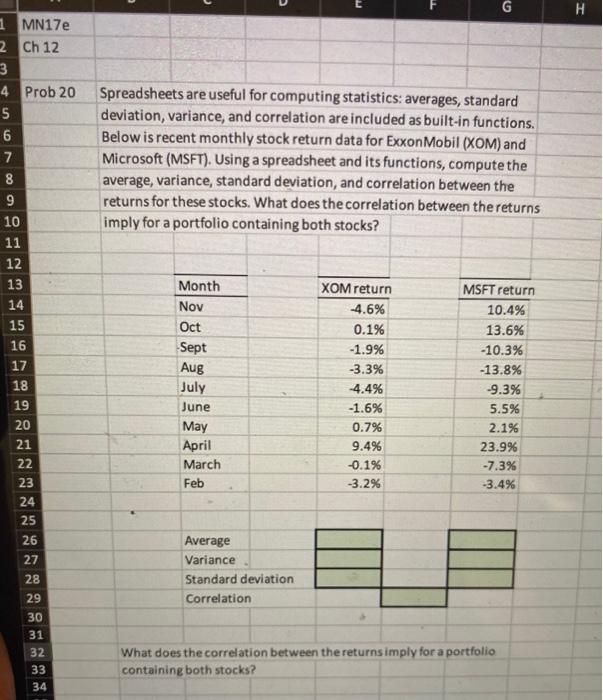
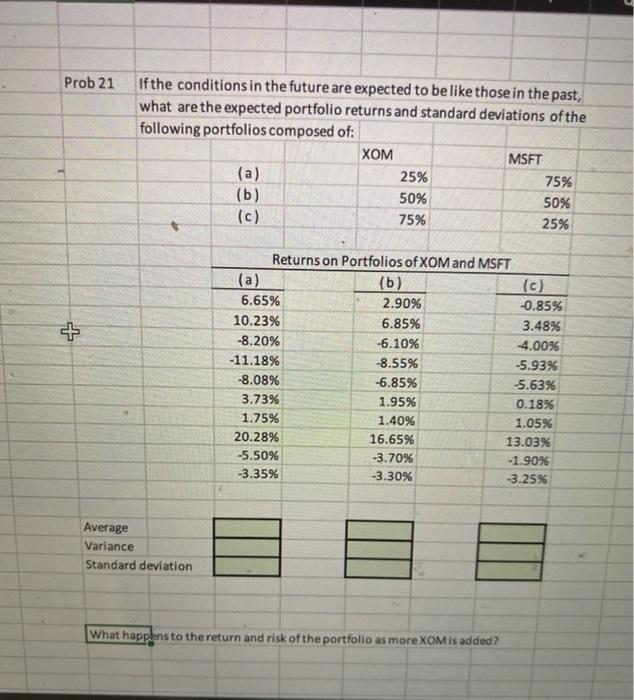
Spreadsheets are useful for computing statistics: averages, standard deviation, variance, and correlation are included as built-in functions. Below is recent monthly stock return data for ExxonMobil (XOM) and Microsoft (MSFT). Using a spreadsheet and its functions, compute the average, variance, standard deviation, and correlation between the returns for these stocks. What does the correlation between the returns imply for a portfolio containino hoth ctarke? Standard deviation Correlation What does the correlation between the returns imply for a portfolio containing both stocks? Prob 21 If the conditions in the future are expected to be like those in the past, what are the expected portfolio returns and standard deviations of the following portfolios composed of: What happlens to the return and risk of the portfolio as more XOM is added Step by Step Solution
There are 3 Steps involved in it
Step: 1

Get Instant Access to Expert-Tailored Solutions
See step-by-step solutions with expert insights and AI powered tools for academic success
Step: 2

Step: 3
Ace Your Homework with AI
Get the answers you need in no time with our AI-driven, step-by-step assistance
Get Started
Finance And The Behavioral Prospect
Authors: James Ming Chen
1st Edition
331981351X, 978-3319813516