 PLEASE ANSWER CORRECTLY AND ASAP
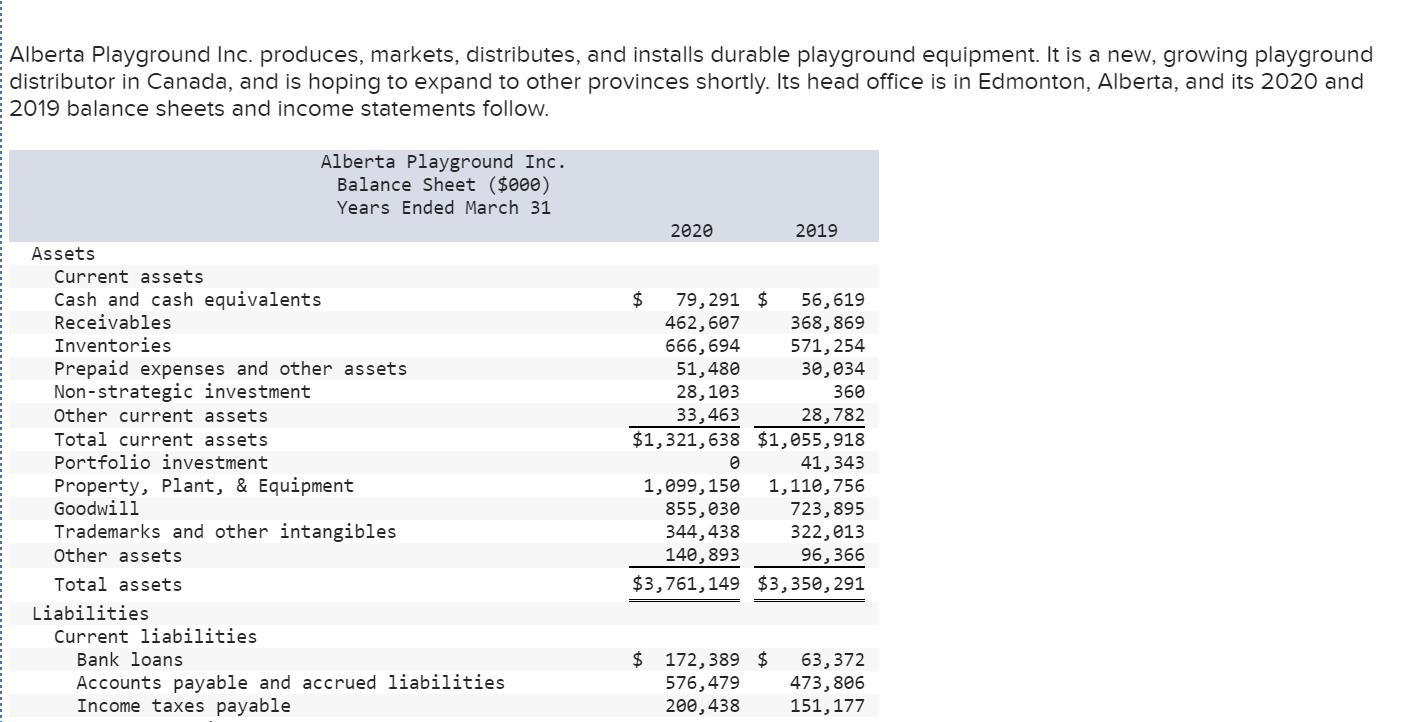
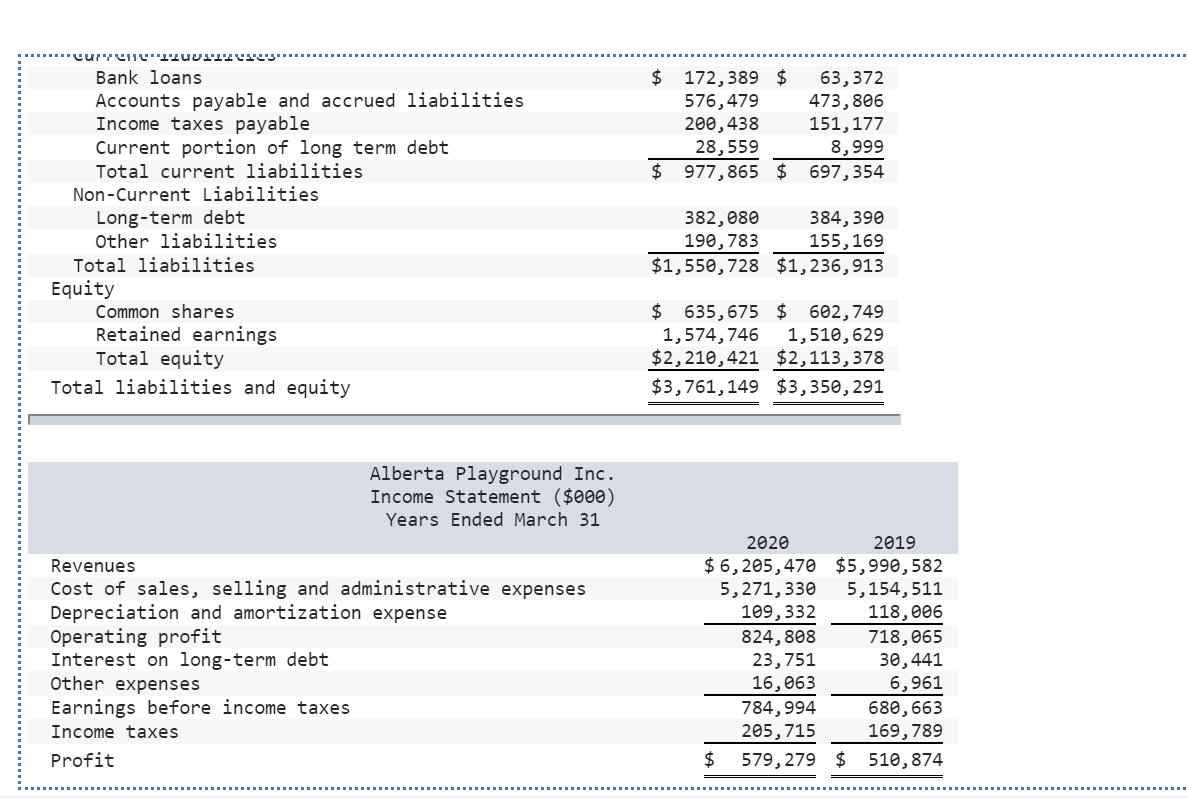
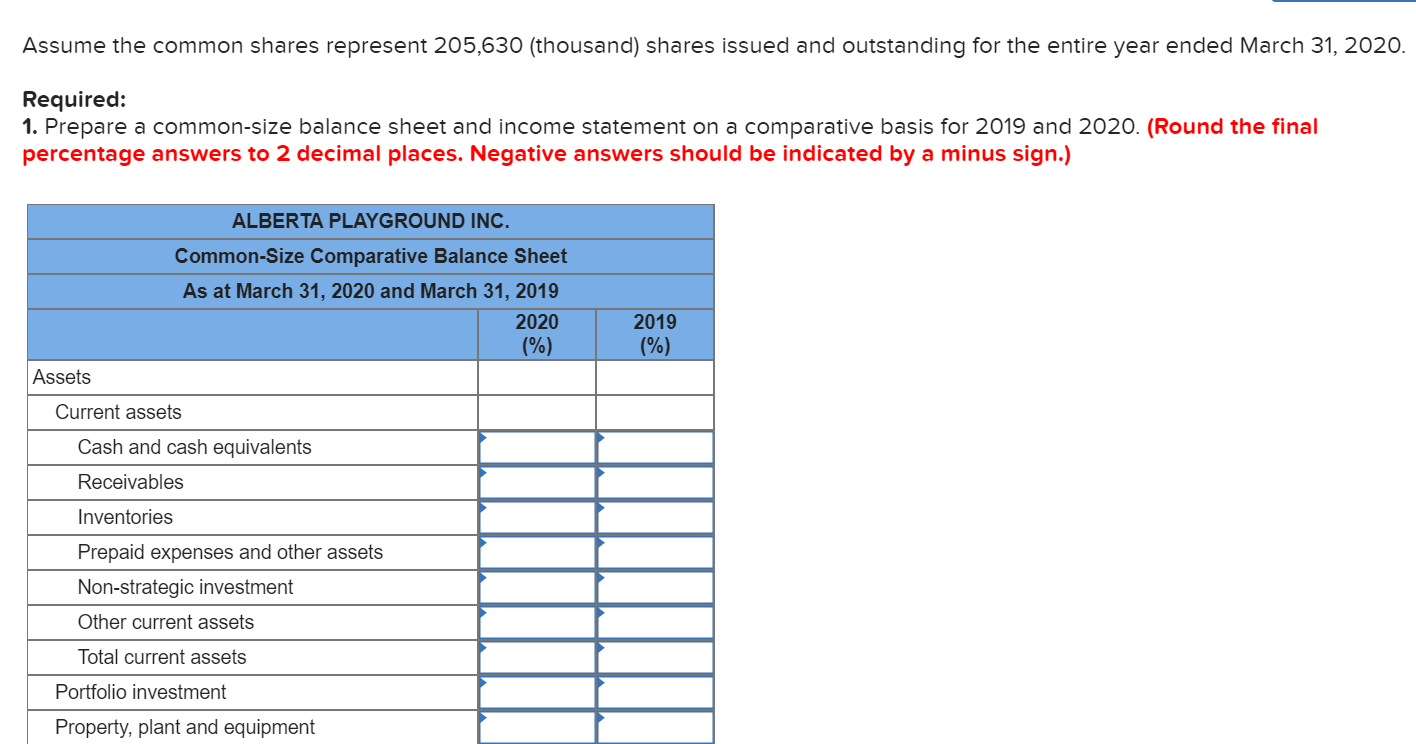
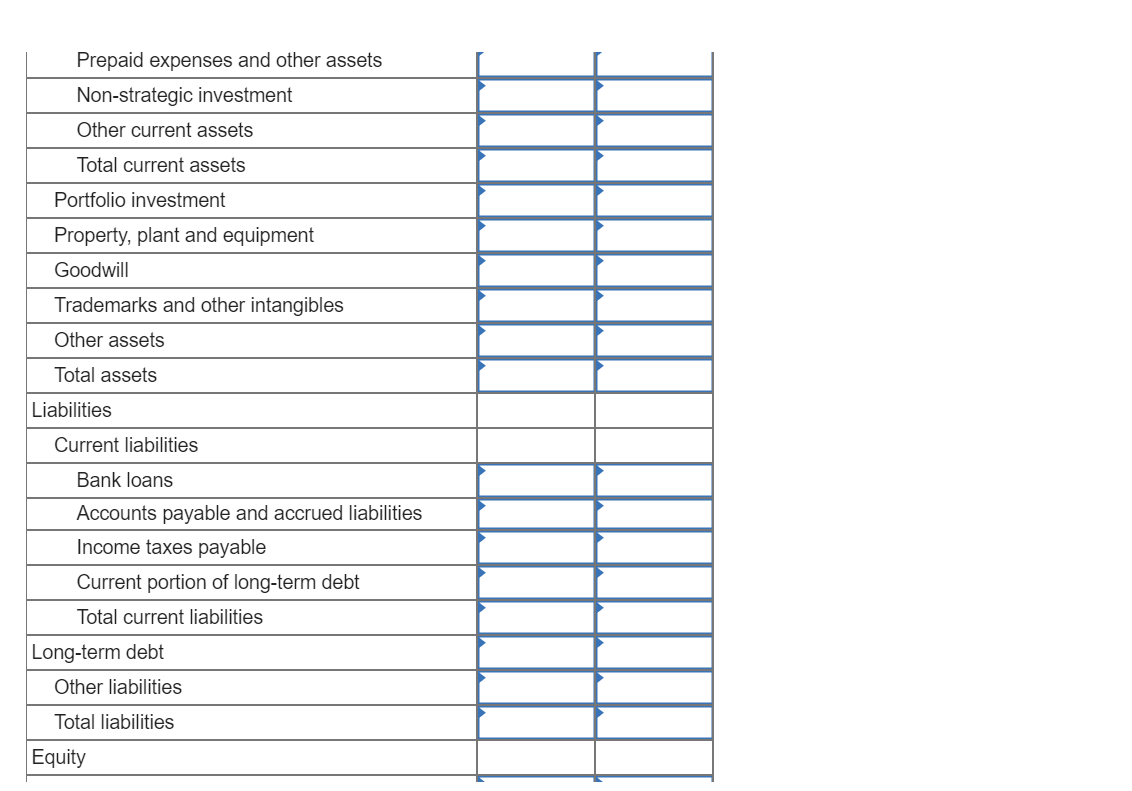
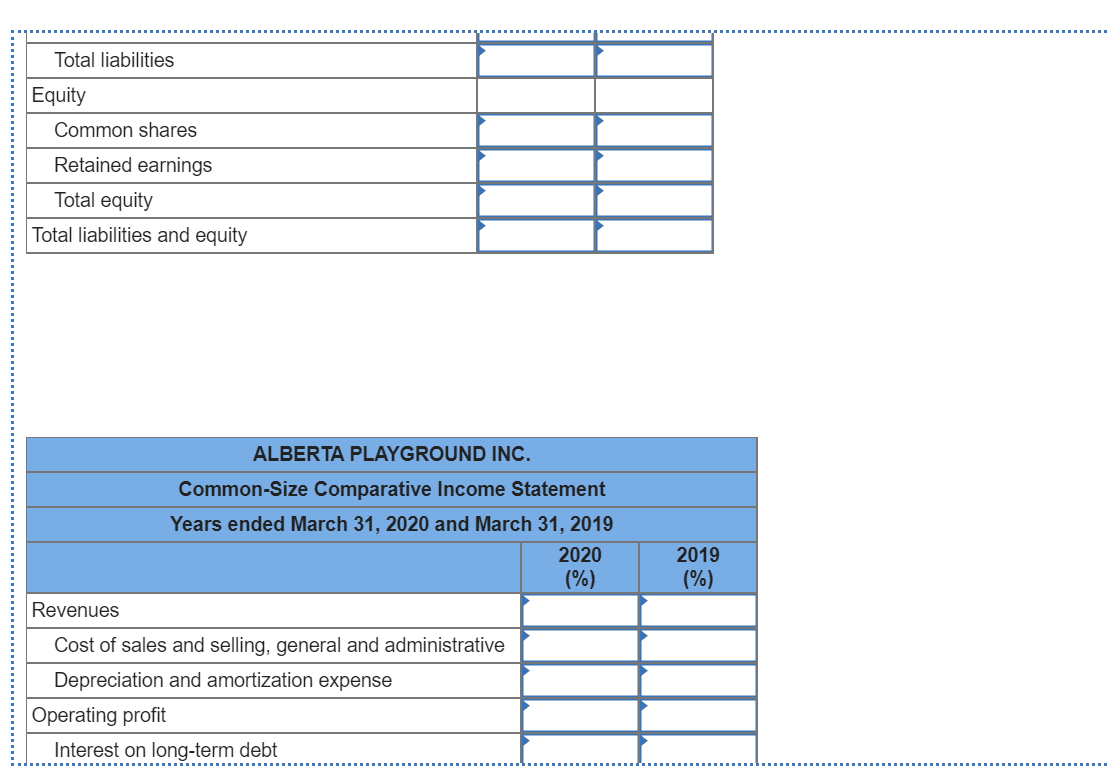
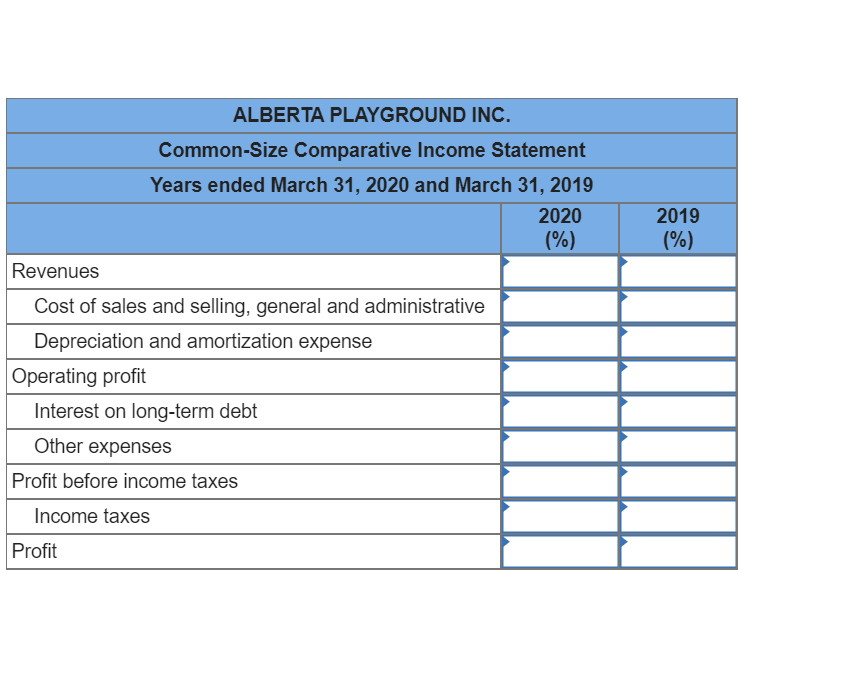
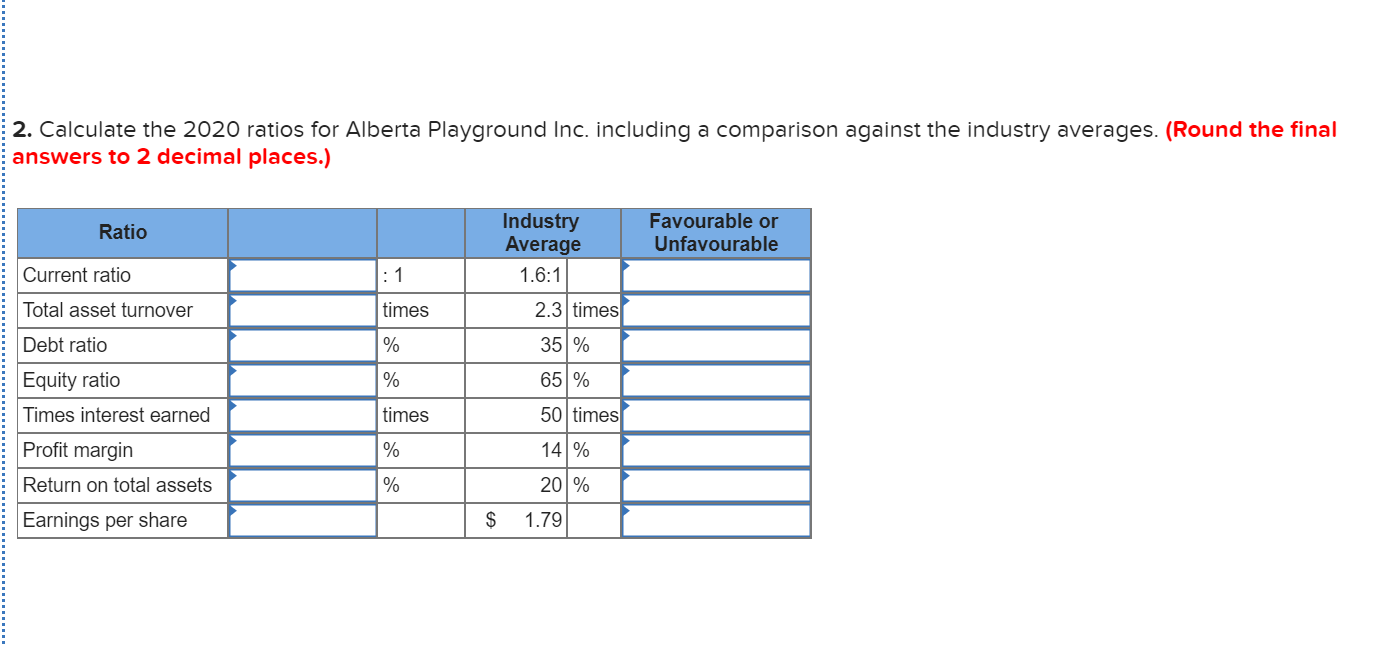
Alberta Playground Inc. produces, markets, distributes, and installs durable playground equipment. It is a new, growing playground distributor in Canada, and is hoping to expand to other provinces shortly. Its head office is in Edmonton, Alberta, and its 2020 and 2019 balance sheets and income statements follow. Alberta Playground Inc. Balance Sheet ($000) Years Ended March 31 2020 2019 Assets Current assets Cash and cash equivalents Receivables Inventories Prepaid expenses and other assets Non-strategic investment Other current assets Total current assets Portfolio investment Property, plant, & Equipment Goodwill Trademarks and other intangibles Other assets Total assets Liabilities Current liabilities Bank loans Accounts payable and accrued liabilities Income taxes payable $ 79,291 $ 56,619 462,607 368,869 666,694 571,254 51,480 30,034 28, 103 360 33,463 28,782 $1,321, 638 $1,055,918 41,343 1,099,150 1,110,756 855,030 723,895 344,438 322,013 140,893 96,366 $3,761,149 $3,350, 291 $ 172,389 $ 576,479 200,438 63,372 473,806 151, 177 $ 172,389 $ 576,479 200,438 28, 559 $ 977,865 $ 63,372 473,806 151, 177 8,999 697,354 ur":"11"/ul> Bank loans Accounts payable and accrued liabilities Income taxes payable Current portion of long term debt Total current liabilities Non-Current Liabilities Long-term debt Other liabilities Total liabilities Equity Common shares Retained earnings Total equity Total liabilities and equity 382,080 384,390 190,783 155,169 $1,550,728 $1,236,913 $ 635,675 $ 602,749 1,574,746 1,510,629 $2,210,421 $2,113,378 $3,761, 149 $3,350, 291 Alberta Playground Inc. Income Statement ($000) Years Ended March 31 Revenues Cost of sales, selling and administrative expenses Depreciation and amortization expense Operating profit Interest on long-term debt Other expenses Earnings before income taxes Income taxes Profit 2020 2019 $ 6, 205,470 $5,990,582 5,271,330 5,154,511 109,332 118,006 824,808 718,065 23,751 30,441 16,063 6,961 784,994 680,663 205,715 169,789 $ 579,279 $ 510,874 Assume the common shares represent 205,630 (thousand) shares issued and outstanding for the entire year ended March 31, 2020. Required: 1. Prepare a common-size balance sheet and income statement on a comparative basis for 2019 and 2020. (Round the final percentage answers to 2 decimal places. Negative answers should be indicated by a minus sign.) ALBERTA PLAYGROUND INC. Common-Size Comparative Balance Sheet As at March 31, 2020 and March 31, 2019 2020 (%) 2019 (%) Assets Current assets Cash and cash equivalents Receivables Inventories Prepaid expenses and other assets Non-strategic investment Other current assets Total current assets Portfolio investment Property, plant and equipment Prepaid expenses and other assets Non-strategic investment Other current assets Total current assets Portfolio investment Property, plant and equipment Goodwill Trademarks and other intangibles Other assets Total assets Liabilities Current liabilities Bank loans Accounts payable and accrued liabilities Income taxes payable Current portion of long-term debt Total current liabilities Long-term debt Other liabilities Total liabilities Equity Total liabilities Equity Common shares Retained earnings Total equity Total liabilities and equity ALBERTA PLAYGROUND INC. Common-Size Comparative Income Statement Years ended March 31, 2020 and March 31, 2019 2020 (%) 2019 (%) Revenues Cost of sales and selling, general and administrative Depreciation and amortization expense Operating profit Interest on long-term debt 2019 (%) ALBERTA PLAYGROUND INC. Common-Size Comparative Income Statement Years ended March 31, 2020 and March 31, 2019 2020 (%) Revenues Cost of sales and selling, general and administrative Depreciation and amortization expense Operating profit Interest on long-term debt Other expenses Profit before income taxes Income taxes Profit 2. Calculate the 2020 ratios for Alberta Playground Inc. including a comparison against the industry averages. (Round the final answers to 2 decimal places.) Ratio Industry Average 1.6:1 Favourable or Unfavourable Current ratio :1 Total asset turnover times 2.3 times 35% % Debt ratio Equity ratio Times interest earned % 65% times 50 times % 14% Profit margin Return on total assets Earnings per share % 20% $ 1.79


 PLEASE ANSWER CORRECTLY AND ASAP


