

Answered step by step
Verified Expert Solution
Question
1 Approved Answer
Please answer correctly Excel Activity: Evaluating Risk and Return Bartman Industries's and Reynolds Inc's stock prices and dividends, along with the Winslow 5000 Index, are
Please answer correctly 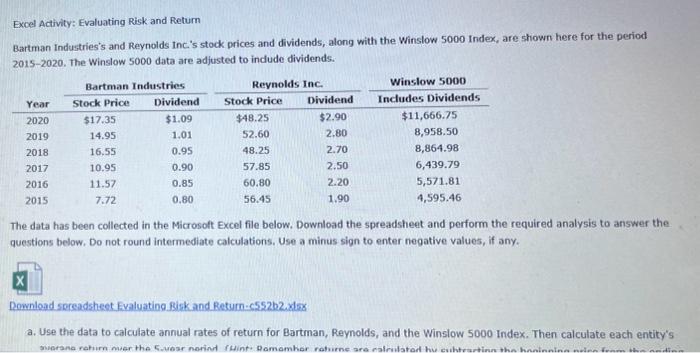
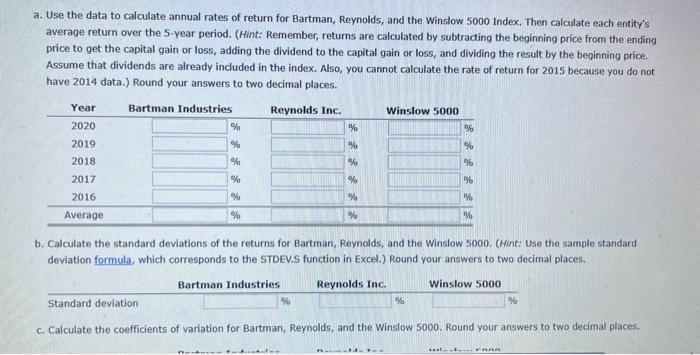
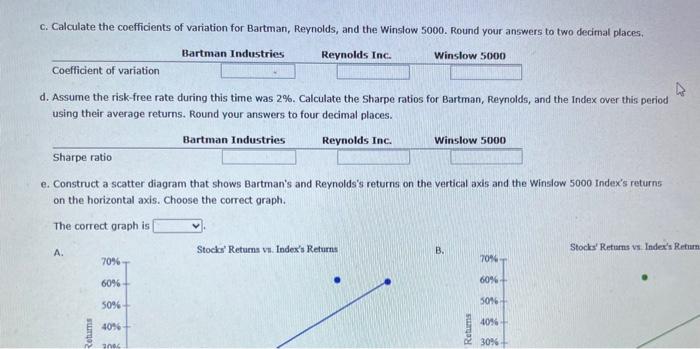
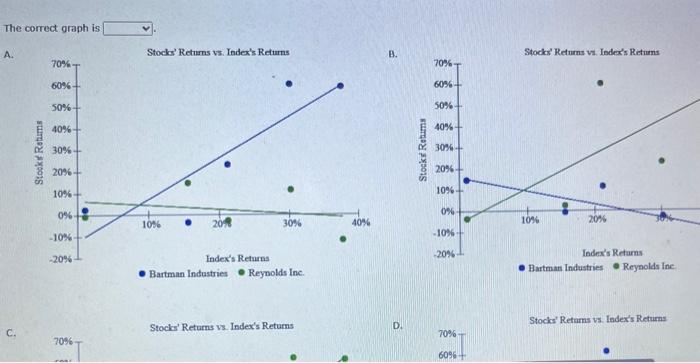
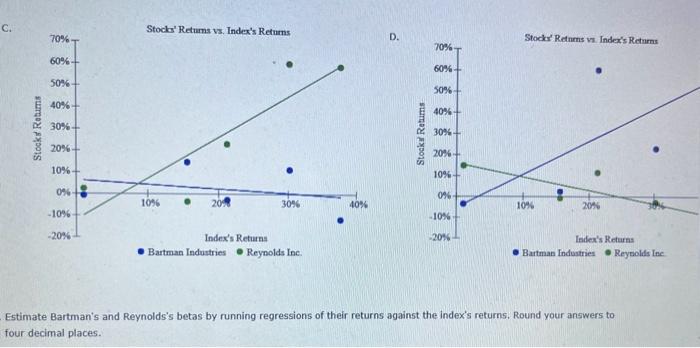
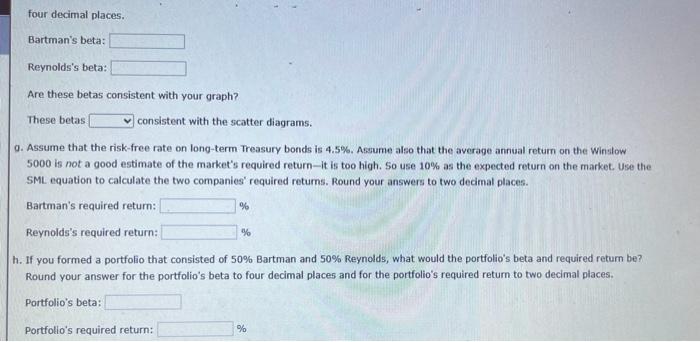
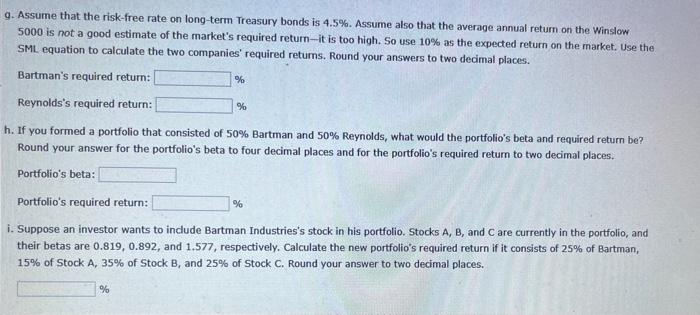
Excel Activity: Evaluating Risk and Return Bartman Industries's and Reynolds Inc's stock prices and dividends, along with the Winslow 5000 Index, are shown here for the period 2015-2020. The Winslow 5000 data are adjusted to include dividends. The data has been collected in the Microsoft Excel file below. Download the spreadsheet and perform the required analysis to answer the questions below, Do not round intermediate calculations. Use a minus sign to enter negative values, if any. Download sereadsheet Evaluating Bisk and Return.-552b2.isls a. Use the data to calculate annual rates of return for Bartman, Reynolds, and the Winslow 5000 Index. Then calculate each entity's a. Use the data to calculate annual rates of return for Bartman, Reynolds, and the Winslow 5000 Index. Then calculate each entity's average return over the 5-year period. (Hint: Remember, retums are calculated by subtracting the beginning price from the ending price to get the capital gain or loss, adding the dividend to the capital gain or loss, and dividing the result by the beginning price. Assume that dividends are already included in the index. Also, you cannot calculate the rate of return for 2015 because you do not have 2014 data.) Round your answers to two decimal places. b. Calculate the standard deviations of the returns for Bartman, Reynolds, and the Winslow 5000 . (Hint: Use the sample standard deviation formula, which corresponds to the STDEV.S function in Excel.) Round your answers to two decimal places. c. Calculate the coefficients of variation for Bartman, Reynolds, and the Winslow 5000 . Round your answers to two decimal places. c. Calculate the coefficients of variation for Bartman, Reynolds, and the Winslow 5000 . Round your answers to two dedimal places, d. Assume the risk-free rate during this time was 2%. Calculate the Sharpe ratios for Bartman, Reynolds, and the Index over this period using their average returns. Round your answers to four decimal places. e. Construct a scatter diagram that shows Bartman's and Reynolds's returns on the vertical axis and the Winslow 5000 index's returns on the horizontal axis. Choose the correct graph. The correct graph is The correct graph is A. B. C. Stocks' Returns vs. Index's Retums D. 70%T Stocks' Retams vs. Index's Retums Estimate Bartman's and Reynolds's betas by running regressions of their returns against the index's returns, Round your answers to four decimal places. four decimal places. Bartman's beta: Reynolds's beta: Are these betas consistent with your graph? These betas consistent with the scatter diagrams. 9. Assume that the risk-free rate on long-term Treasury bonds is 4.5%. Assume also that the average annual retum on the Winsiow 5000 is not a good estimate of the market's required return-it is too high. So use 10% as the expected return on the market. Use the SML. equation to calculate the two companies' required returns. Round your answers to two decimal places. Bartman's required return: Reynolds's required return: h. If you formed a portfolio that consisted of 50% Bartman and 50% Reynolds, what would the portfolio's beta and required return be? Round your answer for the portfolio's beta to four decimal places and for the portfolio's required retum to two decimal places. Portfolio's beta: Portfolio's required return: % 9. Assume that the risk-free rate on long-term Treasury bonds is 4.5%. Assume also that the average annual retum on the Winslow 5000 is not a good estimate of the market's required return-it is too high. So use 10% as the expected return on the market. Use the SML equation to calculate the two companies' required returns. Round your answers to two dedimal places. Bartman's required return: Reynolds's required return: h. If you formed a portfolio that consisted of 50% Bartman and 50% Reynolds, what would the portfolio's beta and required return be? Round your answer for the portfolio's beta to four decimal places and for the portfolio's required return to two decimal places. Portfolio's beta: Portfolio's required return: % i. Suppose an investor wants to indude Bartman Industries's stock in his portfolio. Stocks A, B, and C are currently in the portfolio, and their betas are 0.819,0.892, and 1.577 , respectively. Calculate the new portfolio's required return if it consists of 25% of Bartman, 15% of Stock A, 35% of Stock B, and 25% of Stock C. Round your answer to two decimal places. Excel Activity: Evaluating Risk and Return Bartman Industries's and Reynolds Inc's stock prices and dividends, along with the Winslow 5000 Index, are shown here for the period 2015-2020. The Winslow 5000 data are adjusted to include dividends. The data has been collected in the Microsoft Excel file below. Download the spreadsheet and perform the required analysis to answer the questions below, Do not round intermediate calculations. Use a minus sign to enter negative values, if any. Download sereadsheet Evaluating Bisk and Return.-552b2.isls a. Use the data to calculate annual rates of return for Bartman, Reynolds, and the Winslow 5000 Index. Then calculate each entity's a. Use the data to calculate annual rates of return for Bartman, Reynolds, and the Winslow 5000 Index. Then calculate each entity's average return over the 5-year period. (Hint: Remember, retums are calculated by subtracting the beginning price from the ending price to get the capital gain or loss, adding the dividend to the capital gain or loss, and dividing the result by the beginning price. Assume that dividends are already included in the index. Also, you cannot calculate the rate of return for 2015 because you do not have 2014 data.) Round your answers to two decimal places. b. Calculate the standard deviations of the returns for Bartman, Reynolds, and the Winslow 5000 . (Hint: Use the sample standard deviation formula, which corresponds to the STDEV.S function in Excel.) Round your answers to two decimal places. c. Calculate the coefficients of variation for Bartman, Reynolds, and the Winslow 5000 . Round your answers to two decimal places. c. Calculate the coefficients of variation for Bartman, Reynolds, and the Winslow 5000 . Round your answers to two dedimal places, d. Assume the risk-free rate during this time was 2%. Calculate the Sharpe ratios for Bartman, Reynolds, and the Index over this period using their average returns. Round your answers to four decimal places. e. Construct a scatter diagram that shows Bartman's and Reynolds's returns on the vertical axis and the Winslow 5000 index's returns on the horizontal axis. Choose the correct graph. The correct graph is The correct graph is A. B. C. Stocks' Returns vs. Index's Retums D. 70%T Stocks' Retams vs. Index's Retums Estimate Bartman's and Reynolds's betas by running regressions of their returns against the index's returns, Round your answers to four decimal places. four decimal places. Bartman's beta: Reynolds's beta: Are these betas consistent with your graph? These betas consistent with the scatter diagrams. 9. Assume that the risk-free rate on long-term Treasury bonds is 4.5%. Assume also that the average annual retum on the Winsiow 5000 is not a good estimate of the market's required return-it is too high. So use 10% as the expected return on the market. Use the SML. equation to calculate the two companies' required returns. Round your answers to two decimal places. Bartman's required return: Reynolds's required return: h. If you formed a portfolio that consisted of 50% Bartman and 50% Reynolds, what would the portfolio's beta and required return be? Round your answer for the portfolio's beta to four decimal places and for the portfolio's required retum to two decimal places. Portfolio's beta: Portfolio's required return: % 9. Assume that the risk-free rate on long-term Treasury bonds is 4.5%. Assume also that the average annual retum on the Winslow 5000 is not a good estimate of the market's required return-it is too high. So use 10% as the expected return on the market. Use the SML equation to calculate the two companies' required returns. Round your answers to two dedimal places. Bartman's required return: Reynolds's required return: h. If you formed a portfolio that consisted of 50% Bartman and 50% Reynolds, what would the portfolio's beta and required return be? Round your answer for the portfolio's beta to four decimal places and for the portfolio's required return to two decimal places. Portfolio's beta: Portfolio's required return: % i. Suppose an investor wants to indude Bartman Industries's stock in his portfolio. Stocks A, B, and C are currently in the portfolio, and their betas are 0.819,0.892, and 1.577 , respectively. Calculate the new portfolio's required return if it consists of 25% of Bartman, 15% of Stock A, 35% of Stock B, and 25% of Stock C. Round your answer to two decimal places Step by Step Solution
There are 3 Steps involved in it
Step: 1

Get Instant Access to Expert-Tailored Solutions
See step-by-step solutions with expert insights and AI powered tools for academic success
Step: 2

Step: 3
Ace Your Homework with AI
Get the answers you need in no time with our AI-driven, step-by-step assistance
Get Started
Personal Finance
Authors: Jeff Madura
4th Edition
0136117007, 9780136117001