Please answer extracting values in required box. I will up-vote you surellllly
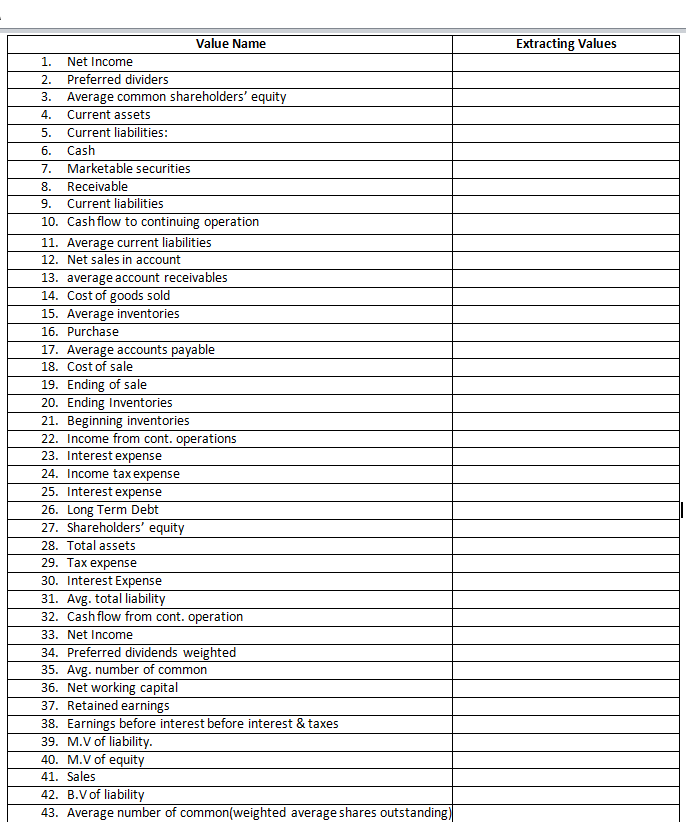
Please extract above required value from the balance sheet and income statement given below
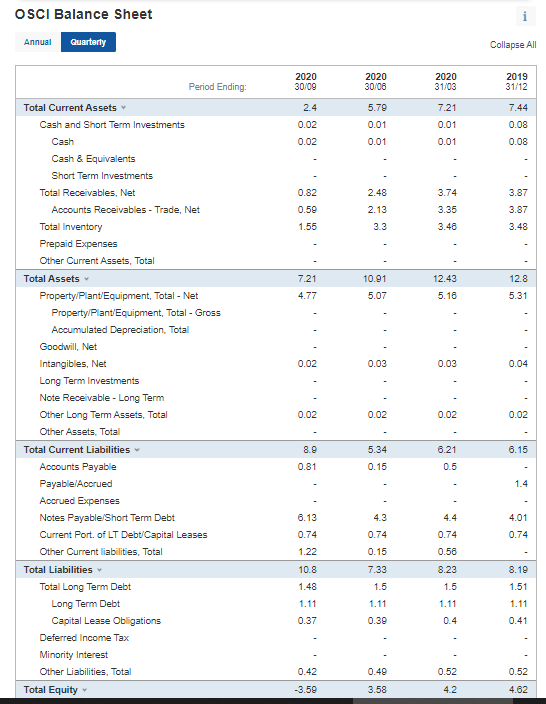
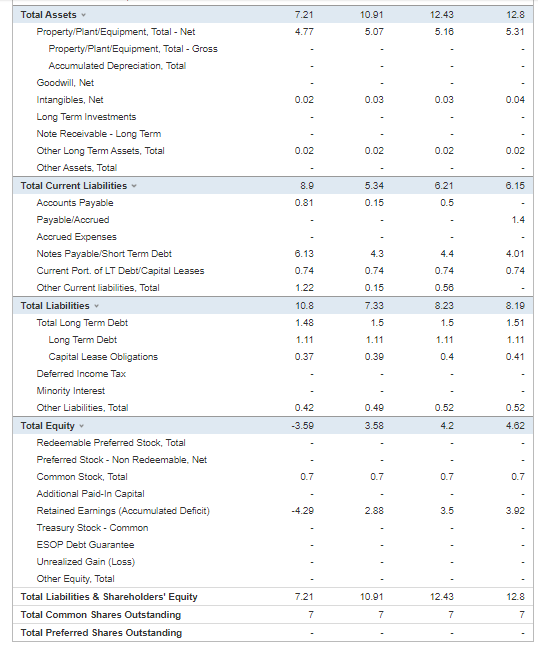
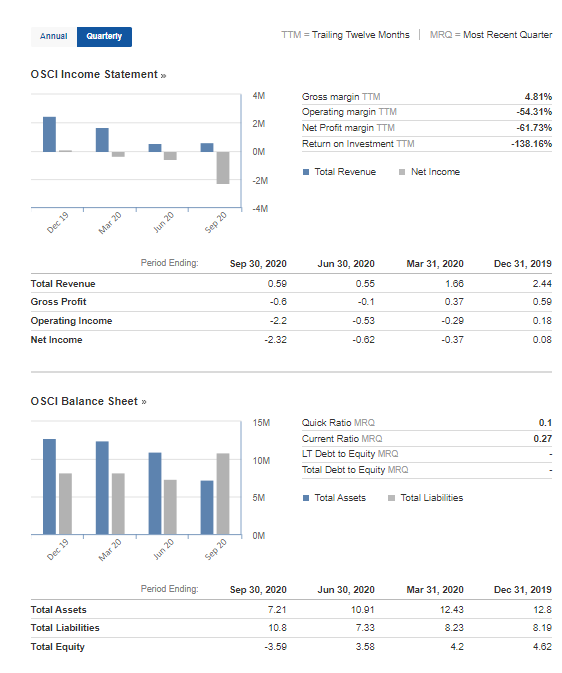
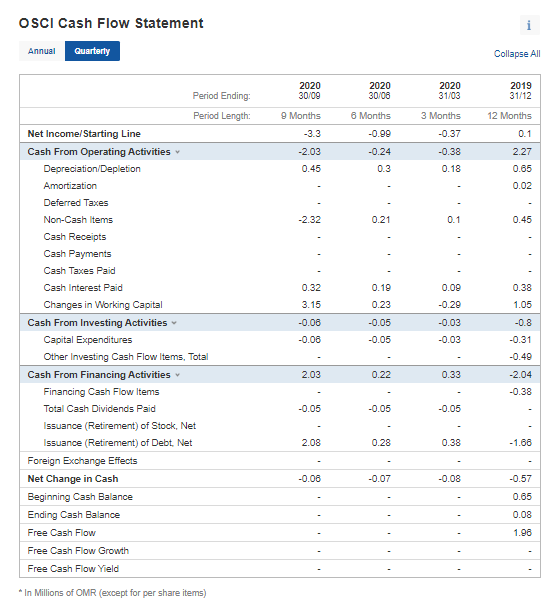
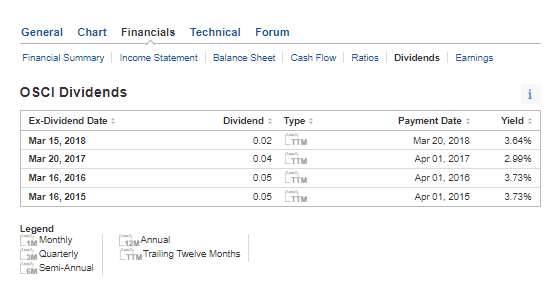
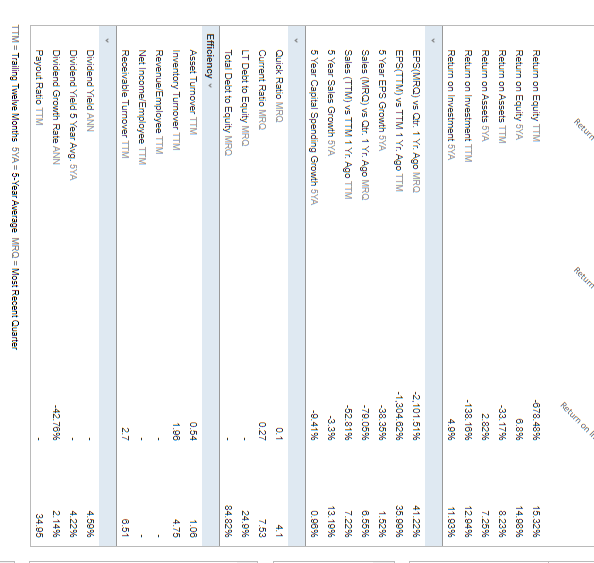

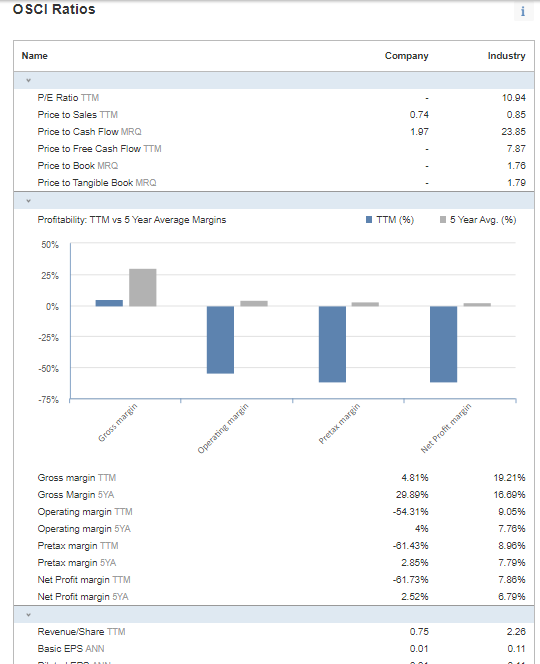
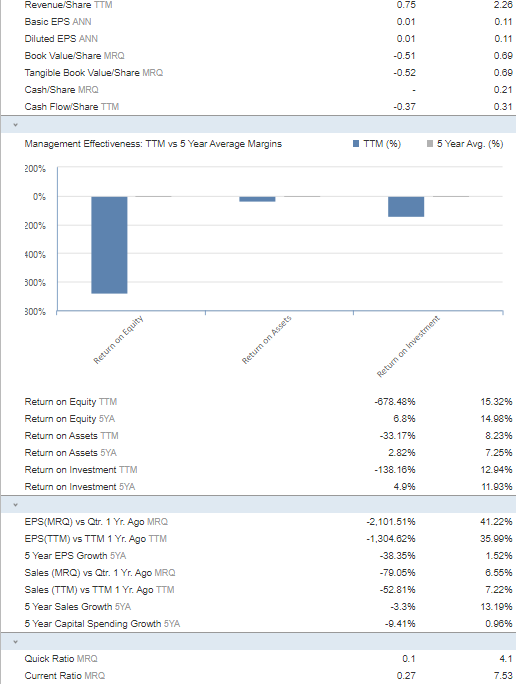
Extracting Values Value Name 1. Net Income 2. Preferred dividers 3. Average common shareholders' equity 4. Current assets 5. Current liabilities: 6. Cash 7. Marketable securities 8. Receivable 9. Current liabilities 10. Cash flow to continuing operation 11. Average current liabilities 12. Net sales in account 13. average account receivables 14. Cost of goods sold 15. Average inventories 16. Purchase 17. Average accounts payable 18. Cost of sale 19. Ending of sale 20. Ending Inventories 21. Beginning inventories 22. Income from cont. operations 23. Interest expense 24. Income tax expense 25. Interest expense 26. Long Term Debt 27. Shareholders' equity 28. Total assets 29. Tax expense 30. Interest Expense 31. Avg. total liability 32. Cash flow from cont. operation 33. Net Income 34. Preferred dividends weighted 35. Avg. number of common 36. Net working capital 37. Retained earnings 38. Earnings before interest before interest & taxes 39. M.V of liability. 40. M.V of equity 41. Sales 42. B.V of liability 43. Average number of common(weighted average shares outstanding) OSCI Balance Sheet Annual Quarterly Collapse All 2020 30/09 2020 30/06 2020 31/03 2019 31/12 2.4 5.79 7.21 7.44 0.08 0.01 0.02 0.02 0.01 0.01 0.01 0.08 0.82 2.48 2.13 3.74 3.35 3.87 3.87 0.59 1.55 3.3 3.48 3.48 12.8 7.21 4.77 10.91 5.07 12.43 5.18 5.31 0.02 0.03 0.03 0.04 Period Ending: Total Current Assets Cash and Short Term Investments Cash Cash & Equivalents Short Term Investments Total Receivables, Net Accounts Receivables - Trade, Net Total Inventory Prepaid Expenses Other Current Assets, Total Total Assets Property/Plant/Equipment, Total - Net Property/Plant/Equipment, Total - Gross Accumulated Depreciation. Total Goodwill, Net Intangibles, Net Long Term Investments Note Receivable - Long Term Other Long Term Assets, Total Other Assets, Total Total Current Liabilities Accounts Payable Payable/Accrued Accrued Expenses Notes Payable/Short Term Debt Current Port of LT Debt Capital Leases Other Current liabilities, Total Total Liabilities Total Long Term Debt Long Term Debt Capital Lease Obligations Deferred Income Tax Minority Interest Other Liabilities, Total Total Equity 0.02 0.02 0.02 0.02 8.9 5.34 6.21 6.15 0.81 0.15 0.5 1.4 4.3 4.4 4.01 6.13 0.74 1.22 0.74 0.74 0.74 0.15 0.58 10.8 8.23 8.19 7.33 1.5 1.48 1.5 1.51 1.11 1.11 1.11 1.11 0.39 0.37 0.4 0.41 0.42 0.49 0.52 0.52 -3.50 3.58 4.2 4.62 7.21 10.91 12.8 12.43 5.18 4.77 5.07 5.31 0.02 0.03 0.03 0.04 0.02 0.02 0.02 0.02 8.9 5.34 6.21 6.15 0.81 0.15 0.5 1.4 4.3 4.4 4.01 6.13 0.74 1.22 0.74 0.74 0.74 0.15 0.58 10.8 1.48 Total Assets Property/Plant Equipment, Total - Net Property/Plant/Equipment, Total - Gross Accumulated Depreciation. Total Goodwill, Net Intangibles, Net Long Term Investments Note Receivable - Long Term Other Long Term Assets, Total Other Assets. Total Total Current Liabilities Accounts Payable Payable/Accrued Accrued Expenses Notes Payable/Short Term Debt Current Port of LT Debt Capital Leases Other Current liabilities. Total Total Liabilities Total Long Term Debt Long Term Debt Capital Lease Obligations Deferred Income Tax Minority Interest Other Liabilities. Total Total Equity Redeemable Preferred Stock, Total Preferred Stock - Non Redeemable, Net Common Stock, Total Additional Paid-In Capital Retained Earnings (Accumulated Deficit) Treasury Stock - Common ESOP Debt Guarantee Unrealized Gain (Loss) Other Equity, Total Total Liabilities & Shareholders' Equity Total Common Shares Outstanding Total Preferred Shares Outstanding 7.33 1.5 8.23 1.5 8.19 1.51 1.11 1.11 1.11 1.11 0.39 0.37 0.4 0.41 0.49 0.52 0.52 0.42 -3.59 3.58 4.2 4.62 0.7 0.7 0.7 0.7 -4 29 2.88 3.5 3.92 7.21 10.91 12.43 12.8 7 7 7 7 Annual Quarterly TTM = Trailing Twelve Months | MRQ = Most Recent Quarter OSCI Income Statement >> 4M 2M Gross margin TTM Operating margin TTM Net Profit margin TTM Return on Investment TTM 4.81% -54.31% -61.73% -138.16% OM Total Revenue Net Income -2M -4M Mar 20 Jun 20 Sep 20 Dec 19 Period Ending: Sep 30, 2020 Mar 31, 2020 Jun 30, 2020 0.55 0.59 1.66 Dec 31, 2019 2.44 0.59 -0.8 -0.1 0.37 Total Revenue Gross Profit Operating Income Net Income -22 -0.53 -0.29 0.18 -2.32 -0.62 -0.37 0.08 OSCI Balance Sheet 15M 0.1 0.27 Quick Ratio MRQ Current Ratio MRO LT Debt to Equity MRQ Total Debt to Equity MRO 10M 5M Total Assets Total Liabilities OM Dec 19 Mar 20 Jun 20 Sep 20 Period Ending Sep 30, 2020 Jun 30, 2020 Mar 31, 2020 Dec 31, 2019 7.21 10.91 12.8 Total Assets Total Liabilities Total Equity 12.43 8.23 10.8 7.33 8.19 -3.59 3.58 4.2 4.62 OSCI Cash Flow Statement Annual Quarterly Collapse All 2020 30/09 2020 30/06 2020 31/03 2019 31/12 12 Months 9 Months -3.3 6 Months -0.99 3 Months -0.37 0.1 2.27 -2.03 0.45 -0.24 0.3 -0.38 0.18 0.65 0.02 -2.32 0.21 0.1 0.45 0.32 0.19 0.09 0.38 3.15 0.23 -0.29 1.05 -0.05 Period Ending Period Length: Net Income/Starting Line Cash From Operating Activities Depreciation/Depletion Amortization Deferred Taxes Non-Cash Items Cash Receipts Cash Payments Cash Taxes Paid Cash Interest Paid Changes in Working Capital Cash From Investing Activities Capital Expenditures Other Investing Cash Flow Items, Total Cash From Financing Activities Financing Cash Flow Items Total Cash Dividends Paid Issuance (Retirement) of Stock, Net Issuance (Retirement) of Debt. Net Foreign Exchange Effects Net Change in Cash Beginning Cash Balance Ending Cash Balance Free Cash Flow Free Cash Flow Growth Free Cash Flow Yield -0.08 -0.00 -0.03 -0.03 -0.05 -0.8 -0.31 -0.49 2.03 0.22 0.33 -2.04 -0.38 -0.05 -0.05 -0.05 2.08 0.28 0.38 -1.68 -0.00 -0.07 -0.08 -0.57 0.65 0.08 1.96 In Millions of OMR (except for per share items) General Chart Financials Technical Forum Financial Summary Income Statement Balance Sheet Cash Flow Ratios Dividends Earnings Yield OSCI Dividends Ex-Dividend Date Mar 15, 2018 Mar 20, 2017 Mar 16, 2016 Mar 16, 2015 Dividend : Type: 0.02 LTTM 0.04 LTTM Payment Date : Mar 20, 2018 Apr 01, 2017 Apr 01, 2016 Apr 01, 2015 3.64% 2.99% 0.05 LTTM 3.73% 0.05 LTTM 3.73% Legend 1 Monthly Si Quarterly GM Semi-Annual 12 Annual LT Trailing Twelve Months Retur Retund Return on -678.48% 15.32% 14.98% 8.23% Return on Equity TTM Return on Equity 5YA Return on Assets TTM Return on Assets 5YA Return on Investment TTM Return on Investment 5YA 6.8% -33.17% 2.82% -138.16% 4.9% 7.2596 12.94% 11.63% 41.22% 35.99% 1.529% EPS(MRO) vs Otr. 1 Yr. Ago MRQ EPS(TTM) vs TTM 1 Yr. Ago TTM 5 Year EPS Growth 5YA Sales (MRQ) vs Qtr. 1 Yr Ago MRQ Sales (TTM) vs TTM 1 Yr. Ago TTM 5 Year Sales Growth 5YA 5 Year Capital Spending Growth SYA -2,101.51% -1,304.629 -38.35% -79.05% -52.81% -3.3% 6.55% 7.2296 13. 19% -9.41 0.96% 4.1 0.1 0.27 7.53 24.9% 84.82% Quick Ratio MRQ Current Ratio MRO LT Debt to Equity MRQ Total Debt to Equity MRO Efficiency Asset Turnover TTM Inventory Tumover TTM Revenue/Employee TTM Net Income/Employee TTM Receivable Turnover TTM 0.54 1.08 4.75 1.96 27 6.51 4.59% 4.22% 2.14% -42.76% Dividend Yield ANN Dividend Yield 5 Year Avg. 5YA Dividend Growth Rate ANN Payout Ratio ITM TTM = Trailing Twelve Months 5YA = 5-Year Average MRQ = Most Recent Quarter 34.95 General Chart Financials Technical Forum Financial Summary Income Statement Balance Sheet Cash Flow Ratios Dividends Earnings Yield OSCI Dividends Ex-Dividend Date Mar 15, 2018 Mar 20, 2017 Mar 16, 2016 Mar 16, 2015 Dividend : Type: 0.02 LTTM 0.04 LTTM Payment Date : Mar 20, 2018 Apr 01, 2017 Apr 01, 2016 Apr 01, 2015 3.64% 2.99% 0.05 LTTM 3.73% 0.05 LTTM 3.73% Legend 1 Monthly Si Quarterly GM Semi-Annual 12 Annual LT Trailing Twelve Months OSCI Ratios Name Company Industry 10.94 0.85 0.74 1.97 PE Ratio TTM Price to Sales TTM Price to Cash Flow MRQ Price to Free Cash Flow TTM Price to Book MRO Price to Tangible Book MRQ 23.85 7.87 1.78 1.79 Profitability. TTM vs 5 Year Average Margins TTM (96) 15 Year Avg. (%) 50% 25% 0% -25% -50% -75% Gross margin Pretax margin Operating margin Net Profit margin 19.21% 18.09% 9.05% 7.78% Gross margin TTM Gross Margin SYA Operating margin TTM Operating margin 5YA Pretax margin TTM Pretax margin 5YA Net Profit margin TTM Net Profit margin 5YA 4.81% 29.899 -54.31% 4% -81.43% 2.85% -81.73% 2.52% 8.96% 7.79% 7.86% 8.79% 0.75 2.26 Revenue/Share TTM Basic EPS ANN 0.01 0.11 2.28 0.11 Revenue/Share TTM Basic EPS ANN Diluted EPS ANN Book Value Share MRQ Tangible Book Value Share MRO Cash/Share MRO Cash FlowShare TTM 0.75 0.01 0.01 -0.51 -0.52 0.11 0.69 0.69 0.21 -0.37 0.31 Management Effectiveness: TTM vs 5 Year Average Margins TTM(%) 15 Year Avg. (%) 200% 0% 200% 400% 300% 300% Return on Equity Return on Assets Return on Investment Return on Equity TTM Return on Equity SYA Return on Assets TTM Return on Assets 5YA Return on Investment TTM Return on Investment 5YA -678.48% 6.8% -33.17% 2.82% 15.32% 14.98% 8.23% 7.25% 12.94% 11.93% -138.16% 4.9% -2,101.51% -1,304.62% -38.35% 41.2296 35.99% EPS(MRQ) vs Qtr. 1 Yr Ago MRQ EPS(TTM) vs TTM 1 Yr. Ago TTM 5 Year EPS Growth SYA Sales (MRQ) vs Qtr. 1 Yr. Ago MRQ Sales (TTM) vs TTM 1 Yr. Ago TTM 5 Year Sales Growth SYA 5 Year Capital Spending Growth 5YA -79.05% -52.81% -3.3% 1.52% 6.55% 7.22% 13. 19% 0.96% -9.41% Quick Ratio MRQ Current Ratio MRQ 0.1 0.27 4.1 7.53 Extracting Values Value Name 1. Net Income 2. Preferred dividers 3. Average common shareholders' equity 4. Current assets 5. Current liabilities: 6. Cash 7. Marketable securities 8. Receivable 9. Current liabilities 10. Cash flow to continuing operation 11. Average current liabilities 12. Net sales in account 13. average account receivables 14. Cost of goods sold 15. Average inventories 16. Purchase 17. Average accounts payable 18. Cost of sale 19. Ending of sale 20. Ending Inventories 21. Beginning inventories 22. Income from cont. operations 23. Interest expense 24. Income tax expense 25. Interest expense 26. Long Term Debt 27. Shareholders' equity 28. Total assets 29. Tax expense 30. Interest Expense 31. Avg. total liability 32. Cash flow from cont. operation 33. Net Income 34. Preferred dividends weighted 35. Avg. number of common 36. Net working capital 37. Retained earnings 38. Earnings before interest before interest & taxes 39. M.V of liability. 40. M.V of equity 41. Sales 42. B.V of liability 43. Average number of common(weighted average shares outstanding) OSCI Balance Sheet Annual Quarterly Collapse All 2020 30/09 2020 30/06 2020 31/03 2019 31/12 2.4 5.79 7.21 7.44 0.08 0.01 0.02 0.02 0.01 0.01 0.01 0.08 0.82 2.48 2.13 3.74 3.35 3.87 3.87 0.59 1.55 3.3 3.48 3.48 12.8 7.21 4.77 10.91 5.07 12.43 5.18 5.31 0.02 0.03 0.03 0.04 Period Ending: Total Current Assets Cash and Short Term Investments Cash Cash & Equivalents Short Term Investments Total Receivables, Net Accounts Receivables - Trade, Net Total Inventory Prepaid Expenses Other Current Assets, Total Total Assets Property/Plant/Equipment, Total - Net Property/Plant/Equipment, Total - Gross Accumulated Depreciation. Total Goodwill, Net Intangibles, Net Long Term Investments Note Receivable - Long Term Other Long Term Assets, Total Other Assets, Total Total Current Liabilities Accounts Payable Payable/Accrued Accrued Expenses Notes Payable/Short Term Debt Current Port of LT Debt Capital Leases Other Current liabilities, Total Total Liabilities Total Long Term Debt Long Term Debt Capital Lease Obligations Deferred Income Tax Minority Interest Other Liabilities, Total Total Equity 0.02 0.02 0.02 0.02 8.9 5.34 6.21 6.15 0.81 0.15 0.5 1.4 4.3 4.4 4.01 6.13 0.74 1.22 0.74 0.74 0.74 0.15 0.58 10.8 8.23 8.19 7.33 1.5 1.48 1.5 1.51 1.11 1.11 1.11 1.11 0.39 0.37 0.4 0.41 0.42 0.49 0.52 0.52 -3.50 3.58 4.2 4.62 7.21 10.91 12.8 12.43 5.18 4.77 5.07 5.31 0.02 0.03 0.03 0.04 0.02 0.02 0.02 0.02 8.9 5.34 6.21 6.15 0.81 0.15 0.5 1.4 4.3 4.4 4.01 6.13 0.74 1.22 0.74 0.74 0.74 0.15 0.58 10.8 1.48 Total Assets Property/Plant Equipment, Total - Net Property/Plant/Equipment, Total - Gross Accumulated Depreciation. Total Goodwill, Net Intangibles, Net Long Term Investments Note Receivable - Long Term Other Long Term Assets, Total Other Assets. Total Total Current Liabilities Accounts Payable Payable/Accrued Accrued Expenses Notes Payable/Short Term Debt Current Port of LT Debt Capital Leases Other Current liabilities. Total Total Liabilities Total Long Term Debt Long Term Debt Capital Lease Obligations Deferred Income Tax Minority Interest Other Liabilities. Total Total Equity Redeemable Preferred Stock, Total Preferred Stock - Non Redeemable, Net Common Stock, Total Additional Paid-In Capital Retained Earnings (Accumulated Deficit) Treasury Stock - Common ESOP Debt Guarantee Unrealized Gain (Loss) Other Equity, Total Total Liabilities & Shareholders' Equity Total Common Shares Outstanding Total Preferred Shares Outstanding 7.33 1.5 8.23 1.5 8.19 1.51 1.11 1.11 1.11 1.11 0.39 0.37 0.4 0.41 0.49 0.52 0.52 0.42 -3.59 3.58 4.2 4.62 0.7 0.7 0.7 0.7 -4 29 2.88 3.5 3.92 7.21 10.91 12.43 12.8 7 7 7 7 Annual Quarterly TTM = Trailing Twelve Months | MRQ = Most Recent Quarter OSCI Income Statement >> 4M 2M Gross margin TTM Operating margin TTM Net Profit margin TTM Return on Investment TTM 4.81% -54.31% -61.73% -138.16% OM Total Revenue Net Income -2M -4M Mar 20 Jun 20 Sep 20 Dec 19 Period Ending: Sep 30, 2020 Mar 31, 2020 Jun 30, 2020 0.55 0.59 1.66 Dec 31, 2019 2.44 0.59 -0.8 -0.1 0.37 Total Revenue Gross Profit Operating Income Net Income -22 -0.53 -0.29 0.18 -2.32 -0.62 -0.37 0.08 OSCI Balance Sheet 15M 0.1 0.27 Quick Ratio MRQ Current Ratio MRO LT Debt to Equity MRQ Total Debt to Equity MRO 10M 5M Total Assets Total Liabilities OM Dec 19 Mar 20 Jun 20 Sep 20 Period Ending Sep 30, 2020 Jun 30, 2020 Mar 31, 2020 Dec 31, 2019 7.21 10.91 12.8 Total Assets Total Liabilities Total Equity 12.43 8.23 10.8 7.33 8.19 -3.59 3.58 4.2 4.62 OSCI Cash Flow Statement Annual Quarterly Collapse All 2020 30/09 2020 30/06 2020 31/03 2019 31/12 12 Months 9 Months -3.3 6 Months -0.99 3 Months -0.37 0.1 2.27 -2.03 0.45 -0.24 0.3 -0.38 0.18 0.65 0.02 -2.32 0.21 0.1 0.45 0.32 0.19 0.09 0.38 3.15 0.23 -0.29 1.05 -0.05 Period Ending Period Length: Net Income/Starting Line Cash From Operating Activities Depreciation/Depletion Amortization Deferred Taxes Non-Cash Items Cash Receipts Cash Payments Cash Taxes Paid Cash Interest Paid Changes in Working Capital Cash From Investing Activities Capital Expenditures Other Investing Cash Flow Items, Total Cash From Financing Activities Financing Cash Flow Items Total Cash Dividends Paid Issuance (Retirement) of Stock, Net Issuance (Retirement) of Debt. Net Foreign Exchange Effects Net Change in Cash Beginning Cash Balance Ending Cash Balance Free Cash Flow Free Cash Flow Growth Free Cash Flow Yield -0.08 -0.00 -0.03 -0.03 -0.05 -0.8 -0.31 -0.49 2.03 0.22 0.33 -2.04 -0.38 -0.05 -0.05 -0.05 2.08 0.28 0.38 -1.68 -0.00 -0.07 -0.08 -0.57 0.65 0.08 1.96 In Millions of OMR (except for per share items) General Chart Financials Technical Forum Financial Summary Income Statement Balance Sheet Cash Flow Ratios Dividends Earnings Yield OSCI Dividends Ex-Dividend Date Mar 15, 2018 Mar 20, 2017 Mar 16, 2016 Mar 16, 2015 Dividend : Type: 0.02 LTTM 0.04 LTTM Payment Date : Mar 20, 2018 Apr 01, 2017 Apr 01, 2016 Apr 01, 2015 3.64% 2.99% 0.05 LTTM 3.73% 0.05 LTTM 3.73% Legend 1 Monthly Si Quarterly GM Semi-Annual 12 Annual LT Trailing Twelve Months Retur Retund Return on -678.48% 15.32% 14.98% 8.23% Return on Equity TTM Return on Equity 5YA Return on Assets TTM Return on Assets 5YA Return on Investment TTM Return on Investment 5YA 6.8% -33.17% 2.82% -138.16% 4.9% 7.2596 12.94% 11.63% 41.22% 35.99% 1.529% EPS(MRO) vs Otr. 1 Yr. Ago MRQ EPS(TTM) vs TTM 1 Yr. Ago TTM 5 Year EPS Growth 5YA Sales (MRQ) vs Qtr. 1 Yr Ago MRQ Sales (TTM) vs TTM 1 Yr. Ago TTM 5 Year Sales Growth 5YA 5 Year Capital Spending Growth SYA -2,101.51% -1,304.629 -38.35% -79.05% -52.81% -3.3% 6.55% 7.2296 13. 19% -9.41 0.96% 4.1 0.1 0.27 7.53 24.9% 84.82% Quick Ratio MRQ Current Ratio MRO LT Debt to Equity MRQ Total Debt to Equity MRO Efficiency Asset Turnover TTM Inventory Tumover TTM Revenue/Employee TTM Net Income/Employee TTM Receivable Turnover TTM 0.54 1.08 4.75 1.96 27 6.51 4.59% 4.22% 2.14% -42.76% Dividend Yield ANN Dividend Yield 5 Year Avg. 5YA Dividend Growth Rate ANN Payout Ratio ITM TTM = Trailing Twelve Months 5YA = 5-Year Average MRQ = Most Recent Quarter 34.95 General Chart Financials Technical Forum Financial Summary Income Statement Balance Sheet Cash Flow Ratios Dividends Earnings Yield OSCI Dividends Ex-Dividend Date Mar 15, 2018 Mar 20, 2017 Mar 16, 2016 Mar 16, 2015 Dividend : Type: 0.02 LTTM 0.04 LTTM Payment Date : Mar 20, 2018 Apr 01, 2017 Apr 01, 2016 Apr 01, 2015 3.64% 2.99% 0.05 LTTM 3.73% 0.05 LTTM 3.73% Legend 1 Monthly Si Quarterly GM Semi-Annual 12 Annual LT Trailing Twelve Months OSCI Ratios Name Company Industry 10.94 0.85 0.74 1.97 PE Ratio TTM Price to Sales TTM Price to Cash Flow MRQ Price to Free Cash Flow TTM Price to Book MRO Price to Tangible Book MRQ 23.85 7.87 1.78 1.79 Profitability. TTM vs 5 Year Average Margins TTM (96) 15 Year Avg. (%) 50% 25% 0% -25% -50% -75% Gross margin Pretax margin Operating margin Net Profit margin 19.21% 18.09% 9.05% 7.78% Gross margin TTM Gross Margin SYA Operating margin TTM Operating margin 5YA Pretax margin TTM Pretax margin 5YA Net Profit margin TTM Net Profit margin 5YA 4.81% 29.899 -54.31% 4% -81.43% 2.85% -81.73% 2.52% 8.96% 7.79% 7.86% 8.79% 0.75 2.26 Revenue/Share TTM Basic EPS ANN 0.01 0.11 2.28 0.11 Revenue/Share TTM Basic EPS ANN Diluted EPS ANN Book Value Share MRQ Tangible Book Value Share MRO Cash/Share MRO Cash FlowShare TTM 0.75 0.01 0.01 -0.51 -0.52 0.11 0.69 0.69 0.21 -0.37 0.31 Management Effectiveness: TTM vs 5 Year Average Margins TTM(%) 15 Year Avg. (%) 200% 0% 200% 400% 300% 300% Return on Equity Return on Assets Return on Investment Return on Equity TTM Return on Equity SYA Return on Assets TTM Return on Assets 5YA Return on Investment TTM Return on Investment 5YA -678.48% 6.8% -33.17% 2.82% 15.32% 14.98% 8.23% 7.25% 12.94% 11.93% -138.16% 4.9% -2,101.51% -1,304.62% -38.35% 41.2296 35.99% EPS(MRQ) vs Qtr. 1 Yr Ago MRQ EPS(TTM) vs TTM 1 Yr. Ago TTM 5 Year EPS Growth SYA Sales (MRQ) vs Qtr. 1 Yr. Ago MRQ Sales (TTM) vs TTM 1 Yr. Ago TTM 5 Year Sales Growth SYA 5 Year Capital Spending Growth 5YA -79.05% -52.81% -3.3% 1.52% 6.55% 7.22% 13. 19% 0.96% -9.41% Quick Ratio MRQ Current Ratio MRQ 0.1 0.27 4.1 7.53