

Answered step by step
Verified Expert Solution
Question
1 Approved Answer
Please answer for all parts, Thank you! Montrose Oil and Lube is a car care center specializing in ten-minute oil changes. Montrose Oil and Lube
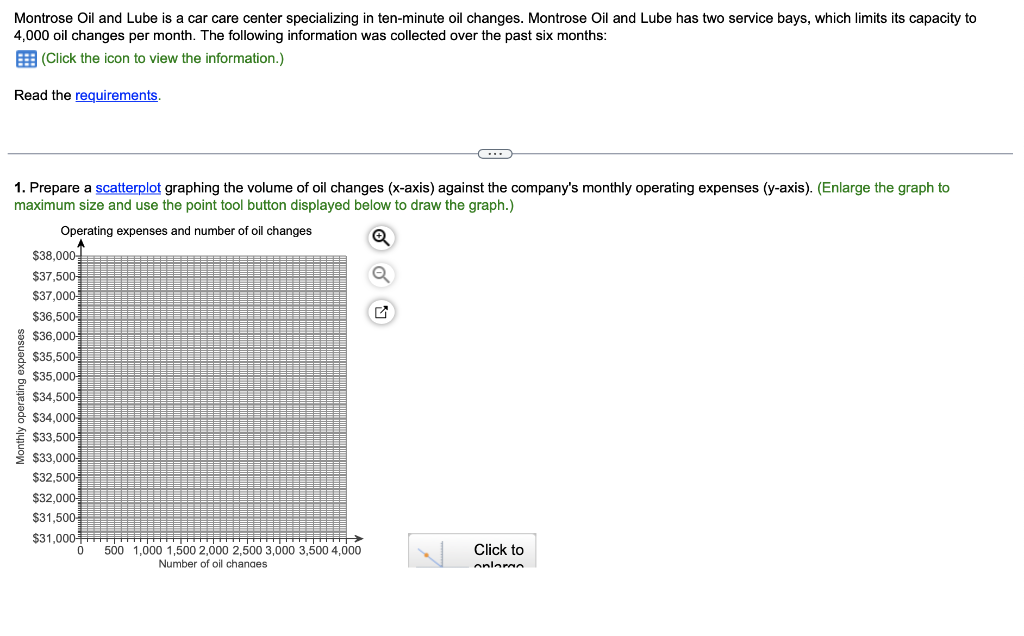
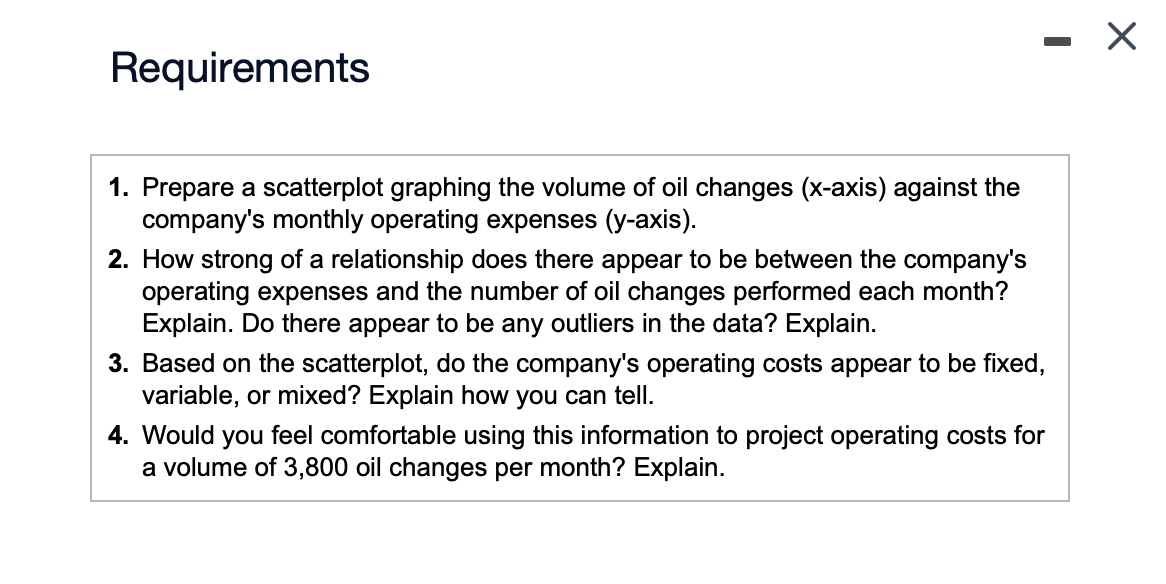
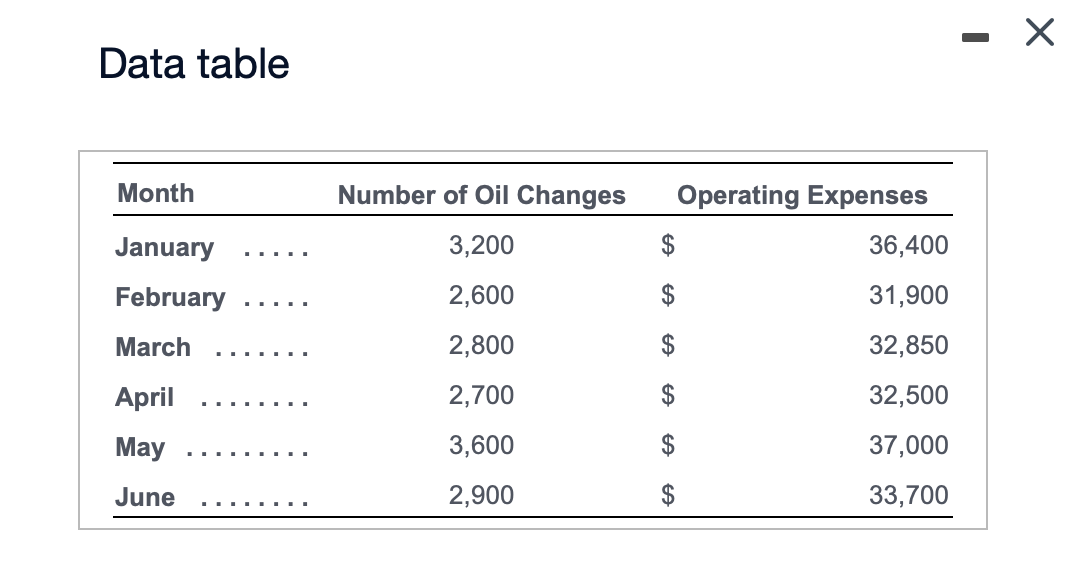 Please answer for all parts, Thank you!
Step by Step Solution
There are 3 Steps involved in it
Step: 1

Get Instant Access to Expert-Tailored Solutions
See step-by-step solutions with expert insights and AI powered tools for academic success
Step: 2

Step: 3
Ace Your Homework with AI
Get the answers you need in no time with our AI-driven, step-by-step assistance
Get Started
Introduction To Managerial Accounting
Authors: Peter C. Brewer
Custom Edition
0077842987, 978-0077842987