

Question
Please answer for the following questions The following figure is the Lead-Tin Phase Diagram of 40wt% Sn-60wt% Pb alloy. 1. For a 40wt%Sn-60wt%Pb alloy at
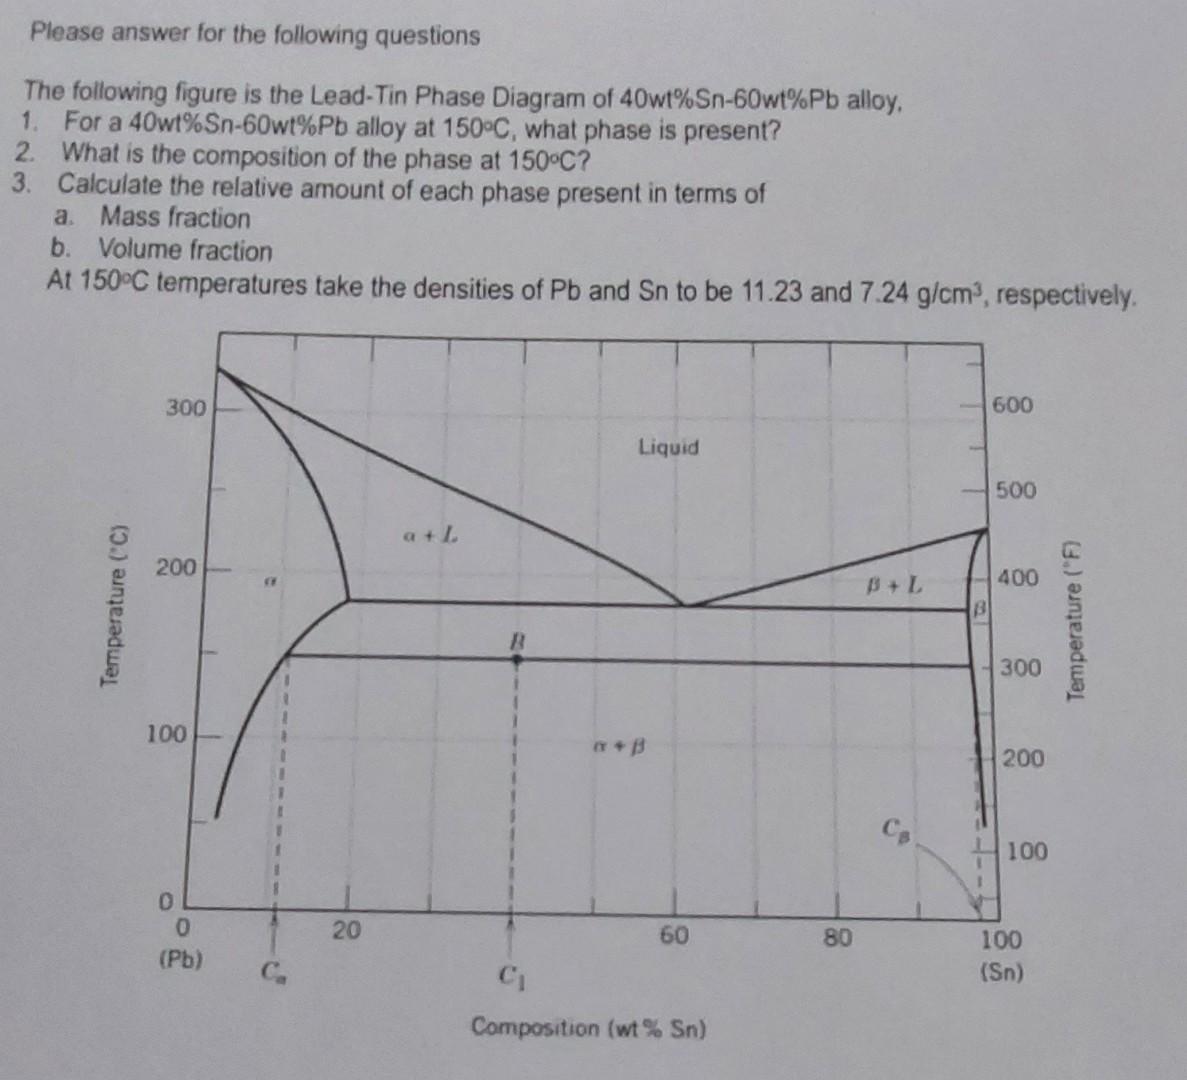
Please answer for the following questions
The following figure is the Lead-Tin Phase Diagram of 40wt% Sn-60wt% Pb alloy.
1. For a 40wt%Sn-60wt%Pb alloy at 150C, what phase is present?
2. What is the composition of the phase at 150C?
3. Calculate the relative amount of each phase present in terms of a. Mass fraction
b. Volume fraction At 150C temperatures take the densities of Pb and Sn to be 11.23 and 7.24 g/cm, respectively.
Please answer for the following questions The following figure is the Lead-Tin Phase Diagram of 40wt%Sn60wt%Pb alloy, 1. For a 40wt%Sn60wt%Pb alloy at 150C, what phase is present? 2. What is the composition of the phase at 150C ? 3. Calculate the relative amount of each phase present in terms of a. Mass fraction b. Volume fraction At 150C temperatures take the densities of Pb and Sn to be 11.23 and 7.24g/cm3, respectivelyStep by Step Solution
There are 3 Steps involved in it
Step: 1

Get Instant Access to Expert-Tailored Solutions
See step-by-step solutions with expert insights and AI powered tools for academic success
Step: 2

Step: 3
Ace Your Homework with AI
Get the answers you need in no time with our AI-driven, step-by-step assistance
Get Started
Elementary Principles of Chemical Processes
Authors: Richard M. Felder, Ronald W. Rousseau
3rd Edition
978-0471687573, 9788126515820, 978-0-471-4152, 0471720631, 047168757X, 8126515821, 978-0471720638