Please answer full question
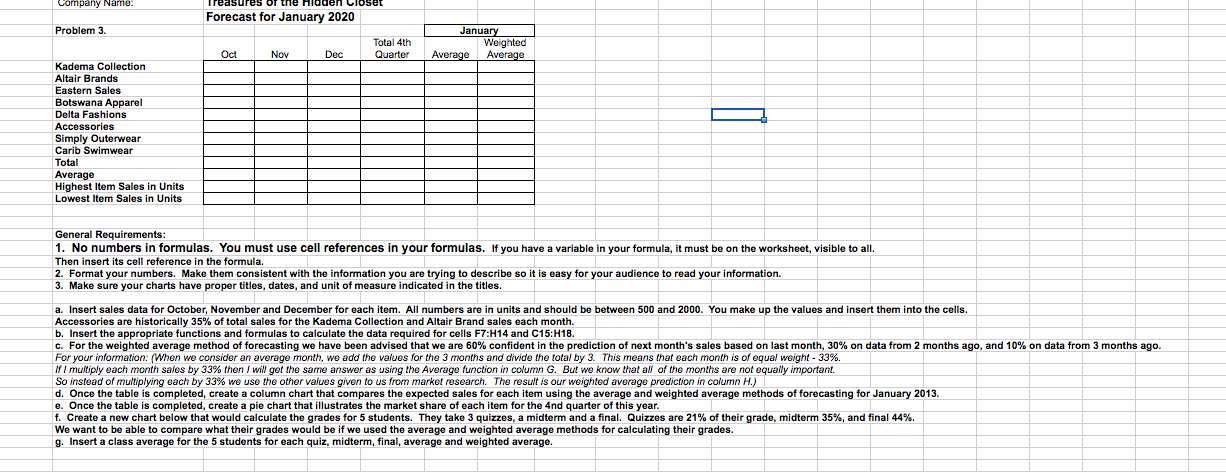
Company Name: Forecast for January 2020 Problem 3. January Total 4th Weighted Oct Nov Dec Quarter Average Average Kadema Collection Altair Brands Eastern Sales Botswana Apparel Delta Fashions Accessories Simply Outerwear Carib Swimwear Total Average Highest Item Sales in Units Lowest Item Sales in Units General Requirements: 1. No numbers in formulas. You must use cell references in your formulas. If you have a variable in your formula, it must be on the worksheet, visible to all. Then insert its cell reference in the formula. 2. Format your numbers. Make them consistent with the information you are trying to describe so it is easy for your audience to read your information. 3. Make sure your charts have proper titles, dates, and unit of measure indicated in the titles. a. Insert sales data for October, November and December for each item. All numbers are in units and should be between 500 and 2000. You make up the values and insert them into the cells. Accessories are historically 35% of total sales for the Kadema Collection and Altair Brand sales each month. b. Insert the appropriate functions and formulas to calculate the data required for cells F7:H14 and C15:H18. c. For the weighted average method of forecasting we have been advised that we are 60% confident in the prediction of next month's sales based on last month, 30% on data from 2 months ago, and 10% on data from 3 months ago. For your information: (When we consider an average month, we add the values for the 3 months and divide the total by 3. This means that each month is of equal weight - 33% If I multiply each month sales by 33% then I will get the same answer as using the Average function in column G. But we know that all of the months are not equally important. So instead of multiplying each by 33% we use the other values given to us from market research. The result is our weighted average prediction in column H.) d. Once the table is completed, create a column chart that compares the expected sales for each item using the average and weighted average methods of forecasting for January 2013. e. Once the table is completed, create a pie chart that illustrates the market share of each item for the and quarter of this year. f. Create a new chart below that would calculate the grades for 5 students. They take 3 quizzes, a midterm and a final. Quizzes are 21% of their grade, midterm 35%, and final 44%. We want to be able to compare what their grades would be if we used the average and weighted average methods for calculating their grades. g. Insert a class average for the 5 students for each quiz, midterm, final, average and weighted average


