

Answered step by step
Verified Expert Solution
Question
1 Approved Answer
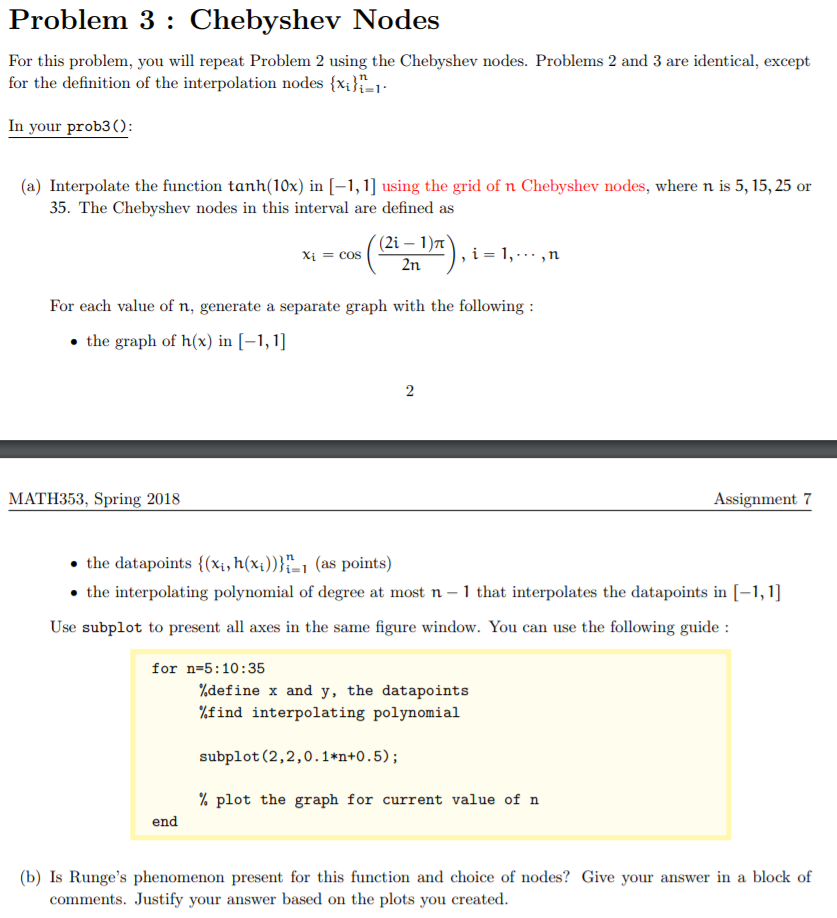
Please answer fully and clearly using MatLab Problem 3: Chebyshev Nodes For this problem, you will repeat Problem 2 using the Chebyshev nodes. Problems 2
Please answer fully and clearly using MatLab
Problem 3: Chebyshev Nodes For this problem, you will repeat Problem 2 using the Chebyshev nodes. Problems 2 and 3 are identical, except for the definition of the interpolation nodes x1 In your prob3): (a) Interpolate the function tanh(10x) in [-1,1] using the grid of n Chebyshev nodes, where n is 5,15,25 or 35. The Chebyshev nodes in this interval are defined as (21-1 )? For each value of n, generate a separate graph with the following the graph of h(x) in [-1,1] MATH353, Spring 2018 Assignment 7 . the datapoints {(Xi, h(Xi))}n-1 (as points) the interpolating polynomial of degree at most n -1 that interpolates the datapoints in [-1,1] Use subplot to present all axes in the same figure window. You can use the following guide for n-5:10:35 %define x and y, the datapoints %find interpolating polynomial subplot (2,2,0.1*nt0.5); % plot the graph for current value of n end (b) Is Runge's phenomenon present for this function and choice of nodes? Give your answer in a block of comments. Justify your r answer based on the plots you created Problem 3: Chebyshev Nodes For this problem, you will repeat Problem 2 using the Chebyshev nodes. Problems 2 and 3 are identical, except for the definition of the interpolation nodes x1 In your prob3): (a) Interpolate the function tanh(10x) in [-1,1] using the grid of n Chebyshev nodes, where n is 5,15,25 or 35. The Chebyshev nodes in this interval are defined as (21-1 )? For each value of n, generate a separate graph with the following the graph of h(x) in [-1,1] MATH353, Spring 2018 Assignment 7 . the datapoints {(Xi, h(Xi))}n-1 (as points) the interpolating polynomial of degree at most n -1 that interpolates the datapoints in [-1,1] Use subplot to present all axes in the same figure window. You can use the following guide for n-5:10:35 %define x and y, the datapoints %find interpolating polynomial subplot (2,2,0.1*nt0.5); % plot the graph for current value of n end (b) Is Runge's phenomenon present for this function and choice of nodes? Give your answer in a block of comments. Justify your r answer based on the plots you createdStep by Step Solution
There are 3 Steps involved in it
Step: 1

Get Instant Access to Expert-Tailored Solutions
See step-by-step solutions with expert insights and AI powered tools for academic success
Step: 2

Step: 3
Ace Your Homework with AI
Get the answers you need in no time with our AI-driven, step-by-step assistance
Get Started
Machine Learning And Knowledge Discovery In Databases European Conference Ecml Pkdd 2014 Nancy France September 15 19 2014 Proceedings Part I Lnai 8724
Authors: Toon Calders ,Floriana Esposito ,Eyke Hullermeier ,Rosa Meo
2014th Edition
3662448475, 978-3662448472