Answered step by step
Verified Expert Solution
Question
1 Approved Answer
Please answer fully. Please create the function in a code file and name all variables in code. Thank you very much. And I'm wondering if
 Please answer fully. Please create the function in a code file and name all variables in code. Thank you very much. And I'm wondering if this question is asking for plots/graphs to be created, because I believe it is asking for two plots to be made.
version of matlab is MATLAB R2020a
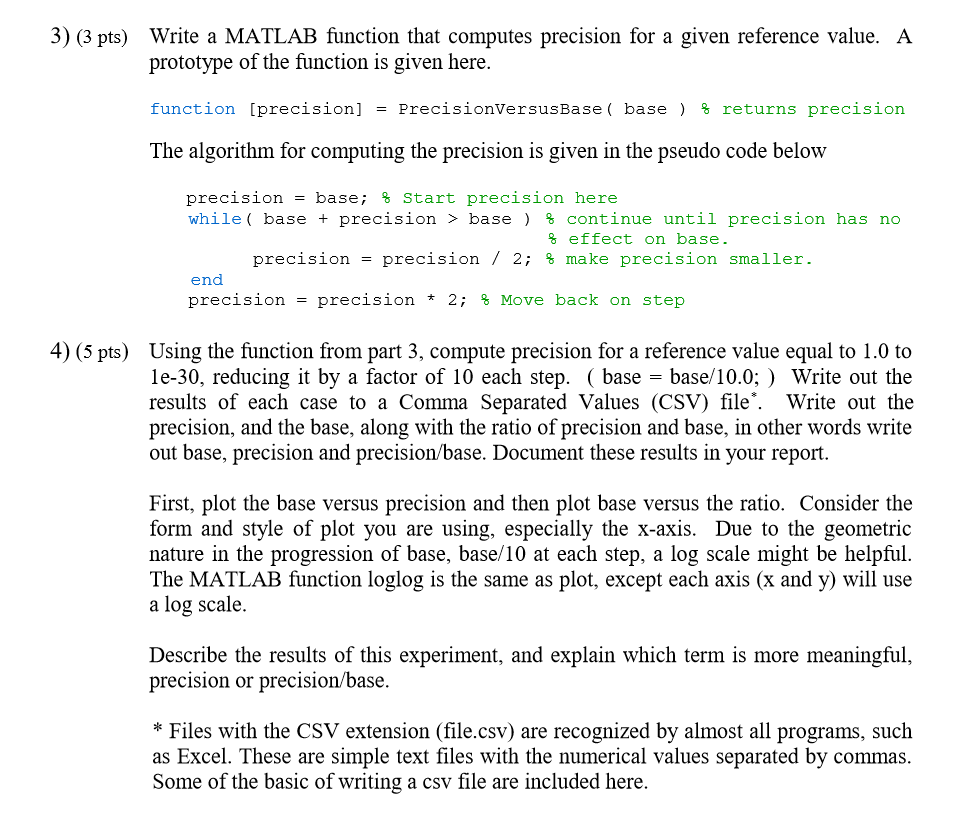
3) (3 pts) Write a MATLAB function that computes precision for a given reference value. A prototype of the function is given here. function [precision] = PrecisionVersusBase ( base ) & returns precision The algorithm for computing the precision is given in the pseudo code below = precision base; f Start precision here while( base + precision > base ) & continue until precision has no f effect on base. precision precision / 2; & make precision smaller. end precision = precision + 2; & Move back on step = 4) (5 pts) Using the function from part 3, compute precision for a reference value equal to 1.0 to 1e-30, reducing it by a factor of 10 each step. ( base = base/10.0; ) Write out the results of each case to a Comma Separated Values (CSV) file" Write out the precision, and the base, along with the ratio of precision and base, in other words write out base, precision and precision/base. Document these results in your report. First, plot the base versus precision and then plot base versus the ratio. Consider the form and style of plot you are using, especially the x-axis. Due to the geometric nature in the progression of base, base/10 at each step, a log scale might be helpful. The MATLAB function loglog is the same as plot, except each axis (x and y) will use a log scale. Describe the results of this experiment, and explain which term is more meaningful, precision or precision/base. * Files with the CSV extension (file.csv) are recognized by almost all programs, such as Excel. These are simple text files with the numerical values separated by commas. Some of the basic of writing a csv file are included here. 3) (3 pts) Write a MATLAB function that computes precision for a given reference value. A prototype of the function is given here. function [precision] = PrecisionVersusBase ( base ) & returns precision The algorithm for computing the precision is given in the pseudo code below = precision base; f Start precision here while( base + precision > base ) & continue until precision has no f effect on base. precision precision / 2; & make precision smaller. end precision = precision + 2; & Move back on step = 4) (5 pts) Using the function from part 3, compute precision for a reference value equal to 1.0 to 1e-30, reducing it by a factor of 10 each step. ( base = base/10.0; ) Write out the results of each case to a Comma Separated Values (CSV) file" Write out the precision, and the base, along with the ratio of precision and base, in other words write out base, precision and precision/base. Document these results in your report. First, plot the base versus precision and then plot base versus the ratio. Consider the form and style of plot you are using, especially the x-axis. Due to the geometric nature in the progression of base, base/10 at each step, a log scale might be helpful. The MATLAB function loglog is the same as plot, except each axis (x and y) will use a log scale. Describe the results of this experiment, and explain which term is more meaningful, precision or precision/base. * Files with the CSV extension (file.csv) are recognized by almost all programs, such as Excel. These are simple text files with the numerical values separated by commas. Some of the basic of writing a csv file are included hereStep by Step Solution
There are 3 Steps involved in it
Step: 1

Get Instant Access to Expert-Tailored Solutions
See step-by-step solutions with expert insights and AI powered tools for academic success
Step: 2

Step: 3

Ace Your Homework with AI
Get the answers you need in no time with our AI-driven, step-by-step assistance
Get Started


