

Question
Please answer How are pre-tax net profit margin, total asset turnover, and total debt ratio affecting the firms pre- tax return on assets (ROA) and
Please answer 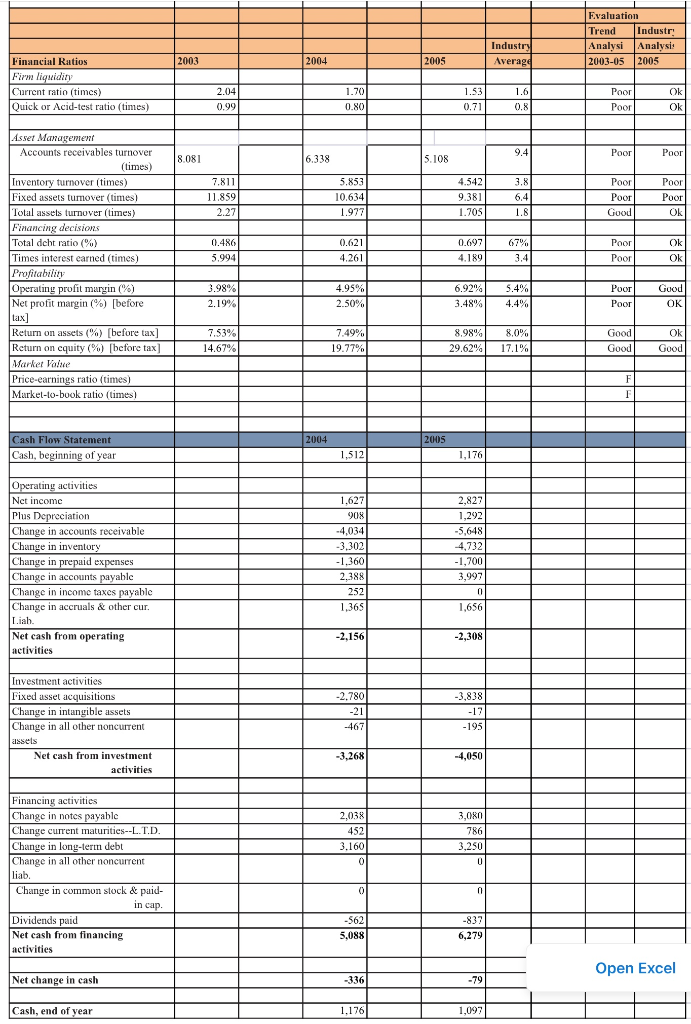 How are pre-tax net profit margin, total asset turnover, and total debt ratio affecting the firms pre-
tax return on assets (ROA) and return on equity (ROE)? What is your overall assessment of the firms
profitability, including its earnings per share
(EPS)?
Evaluation Trend Industri Analysi Analysi: 2003-05 2005 Industry Average 2003 2004 2005 Financial Ratios Firm liquidity Current ratio (times) Quick or Acid-test ratio (times) OK 2.04 0.99 1.70 0.80 1.53 0.71 1.6 0.8 Poor Poor OK Poor Poor 8.081 6.338 5.108 7.811 11.859 2.27 5.853 10.634 1.977 4.542 9.381 1.709 3.8 6,4 1.8 Poor Poor Good Poor Poor OK 0.486 5.994 0.621 4.261 0.697 4.189 67% 3.4 Poor Poor Ok OK Asset Management Accounts receivables turnover (times) Inventory turnover (times) Fixed assets tumover times) Total assets turnover (times) Financing decisions Total dcht ratio (%) Times interest carned (times) Profitability Operating profit margin (%) Net profit margin (%) [before tax] Return on assets (%) [before tax Return on cquity (%) [before tax Market Value Price-earnings ratio (times) Market-to-book ratio (times) 3.98% 2.19% 4.95% 2.50% 6.92% 3.48% 5.4% 4.4% Poor Poor Good OK 7.53% 14.67% 7.49% 19.77% 8.98% 29.62% 8.0% 17.1% Good Good OK Good F I 2004 2005 Cash Flow Statement Cash, beginning of year 1,512 1,176 Operating activities Net income Plus Depreciation Change in accounts receivable Change in inventory Change in prepaid expenses Change in accounts payable Change in income taxes payable Change in accruals & other our Liah. Net cash from operating activities 1.627 908 -4,034 -3.302 -1,360 2,388 252 1,365 2,827 1,292 -5,648 4,732 -1,700 3,997 0 1,656 -2,156 -2,308 Investment activities Fixed asset acquisitions Change in intangible assets Change in all other noncurrent assels Net cash from investment activities -2.780 -21 -467 -3.838 -12 -195 -3,268 -4,050 2,038 452 3.160 0 3,080 786 3,250 U Financing activities Change in notes payable Change current maturities--L.T.D. Change in long-term debt Change in all other noncurrent liab Change in common stock & paid- in cap. Dividends paid Net cash from financing activities 0 n -562 5,088 -837 6.279 Open Excel Net change in cash -336 -79 Cash, end of year 1,176 1,097 Evaluation Trend Industri Analysi Analysi: 2003-05 2005 Industry Average 2003 2004 2005 Financial Ratios Firm liquidity Current ratio (times) Quick or Acid-test ratio (times) OK 2.04 0.99 1.70 0.80 1.53 0.71 1.6 0.8 Poor Poor OK Poor Poor 8.081 6.338 5.108 7.811 11.859 2.27 5.853 10.634 1.977 4.542 9.381 1.709 3.8 6,4 1.8 Poor Poor Good Poor Poor OK 0.486 5.994 0.621 4.261 0.697 4.189 67% 3.4 Poor Poor Ok OK Asset Management Accounts receivables turnover (times) Inventory turnover (times) Fixed assets tumover times) Total assets turnover (times) Financing decisions Total dcht ratio (%) Times interest carned (times) Profitability Operating profit margin (%) Net profit margin (%) [before tax] Return on assets (%) [before tax Return on cquity (%) [before tax Market Value Price-earnings ratio (times) Market-to-book ratio (times) 3.98% 2.19% 4.95% 2.50% 6.92% 3.48% 5.4% 4.4% Poor Poor Good OK 7.53% 14.67% 7.49% 19.77% 8.98% 29.62% 8.0% 17.1% Good Good OK Good F I 2004 2005 Cash Flow Statement Cash, beginning of year 1,512 1,176 Operating activities Net income Plus Depreciation Change in accounts receivable Change in inventory Change in prepaid expenses Change in accounts payable Change in income taxes payable Change in accruals & other our Liah. Net cash from operating activities 1.627 908 -4,034 -3.302 -1,360 2,388 252 1,365 2,827 1,292 -5,648 4,732 -1,700 3,997 0 1,656 -2,156 -2,308 Investment activities Fixed asset acquisitions Change in intangible assets Change in all other noncurrent assels Net cash from investment activities -2.780 -21 -467 -3.838 -12 -195 -3,268 -4,050 2,038 452 3.160 0 3,080 786 3,250 U Financing activities Change in notes payable Change current maturities--L.T.D. Change in long-term debt Change in all other noncurrent liab Change in common stock & paid- in cap. Dividends paid Net cash from financing activities 0 n -562 5,088 -837 6.279 Open Excel Net change in cash -336 -79 Cash, end of year 1,176 1,097Step by Step Solution
There are 3 Steps involved in it
Step: 1

Get Instant Access to Expert-Tailored Solutions
See step-by-step solutions with expert insights and AI powered tools for academic success
Step: 2

Step: 3
Ace Your Homework with AI
Get the answers you need in no time with our AI-driven, step-by-step assistance
Get Started
Performance Audit Department Of Highways Preconstruction And Construction Activities
Authors: Montana. Legislature. Office Of The Legi
1st Edition
1175365823, 978-1175365828