Answered step by step
Verified Expert Solution
Link Copied!

Question

1 Approved Answer

Please answer in full details with full steps how you got to your conclusion and round all answers to 2 decimal points! Thank you! 1)

Please answer in full details with full steps how you got to your conclusion and round all answers to 2 decimal points! Thank you!
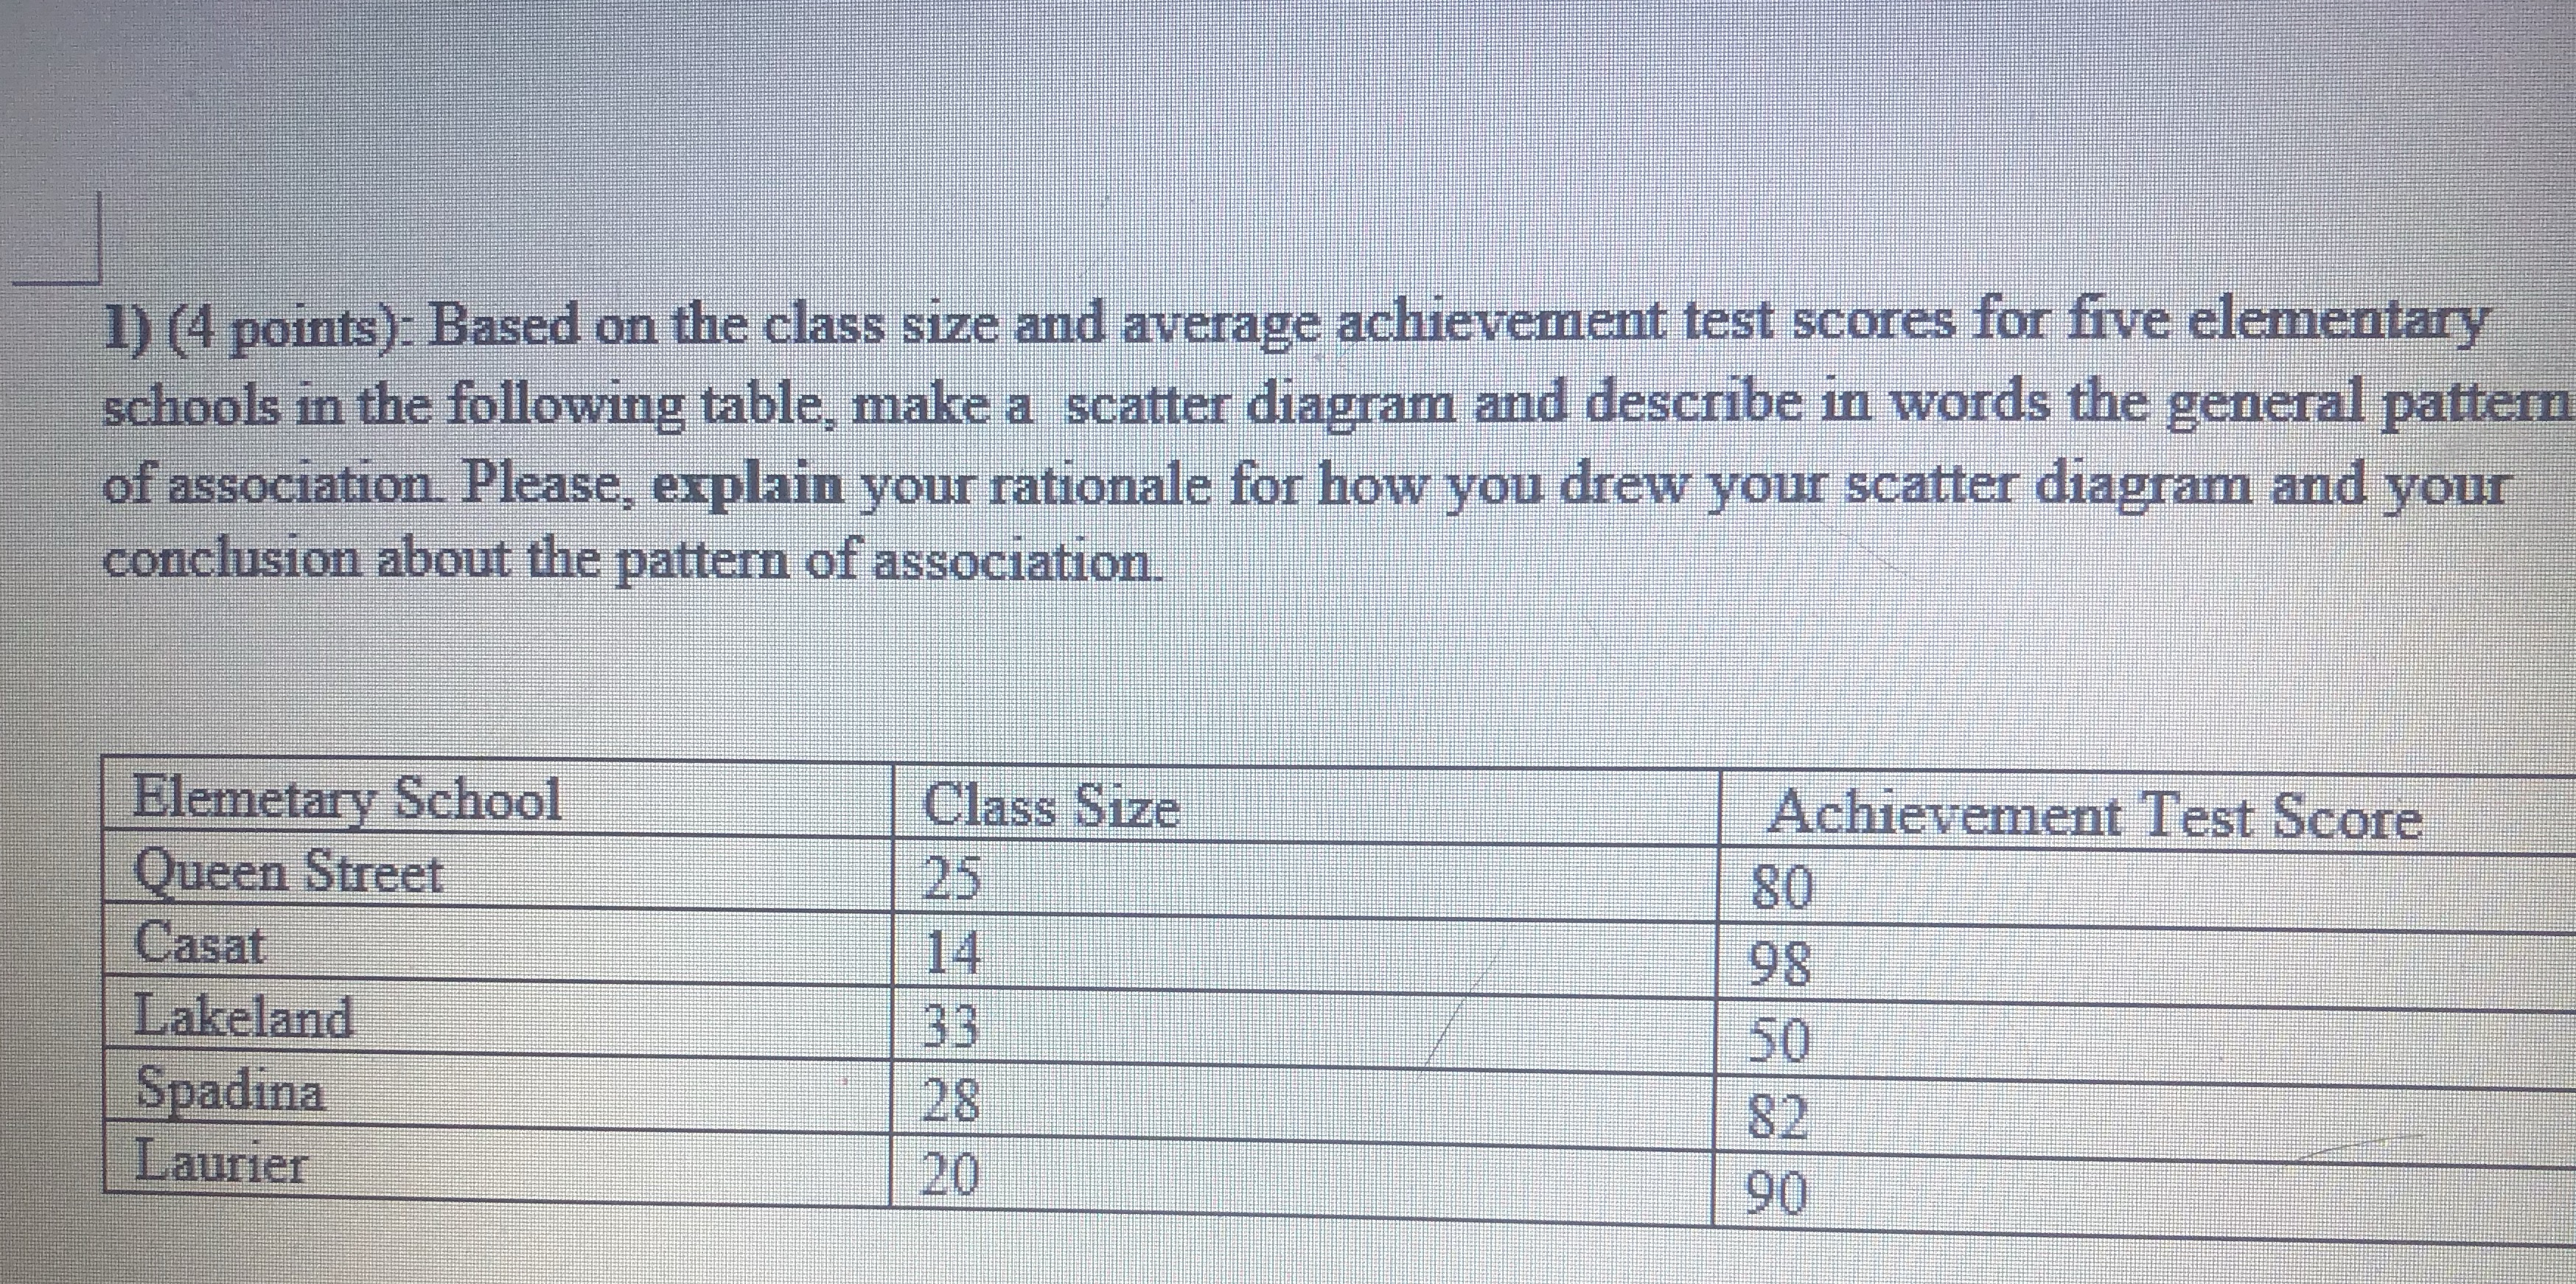
image text in transcribed
1) (4 points): Based on the class size and average achievement test scores for five elementary schools in the following table, make a scatter diagram and describe in words the general pattern of association. Please, explain your rationale for how you drew your scatter diagram and your conclusion about the pattern of association. Elemetary School Class Size Achievement Test Score Queen Street 25 80 Casat 14 98 Lakeland 33 50 Spadina 28 82 Laurier 20 90

Step by Step Solution

There are 3 Steps involved in it

Step: 1

blur-text-image

Get Instant Access to Expert-Tailored Solutions

See step-by-step solutions with expert insights and AI powered tools for academic success

Step: 2

blur-text-image

Step: 3

blur-text-image

Ace Your Homework with AI

Get the answers you need in no time with our AI-driven, step-by-step assistance

Get Started

Recommended Textbook for

Calculus An Applied Approach

Authors: Ron Larson, Dennis J McKenzie, Larson/Edwards, Bruce H Edwards

7th Edition

1111809720, 9781111809720

More Books

Students also viewed these Mathematics questions

Question

explain what is meant by experiential learning

Answered: 1 week ago

Question

identify the main ways in which you learn

Answered: 1 week ago