Answered step by step
Verified Expert Solution
Question
1 Approved Answer
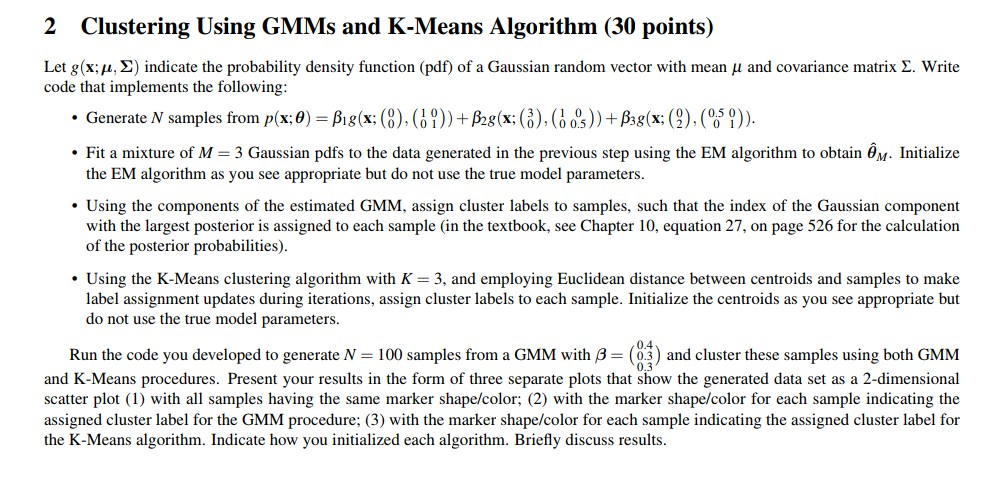
Please answer in MATLAB 2 Clustering Using GMMs and K-Means Algorithm (30 points) Let g(x: ) indicate the probability density function (pdf) of a Gaussian

Please answer in MATLAB
2 Clustering Using GMMs and K-Means Algorithm (30 points) Let g(x: ) indicate the probability density function (pdf) of a Gaussian random vector with mean and covariance matrix . Write code that implements the following . Generate N samples from p(x:0) 1g(x: (8),(H)1+Ag(x:8).Gds))+3g(x(1), (0 9)) Fit a mixture of M = 3 Gaussian pdfs to the data generated in the previous step using the EM algorithm to obtain . Initialize the EM algorithm as you see appropriate but do not use the true model parameters Using the components of the estimated GMM, assign cluster labels to samples, such that the index of the Gaussian component with the largest posterior is assigned to each sample (in the textbook, see Chapter 10, equation 27, on page 526 for the calculation of the posterior probabilities) Using the K-Means clustering algorithm with K = 3, and employing Euclidean distance between centroids and samples to make label assignment updates during iterations, assign cluster labels to each sample. Initialize the centroids as you see appropriate but do not use the true model parameters. Run the code you developed to generate N 100 samples from a GMM with s-) and cluster these samples using both GMM and K-Means procedures. Present your results in the form of three separate plots that show the generated data set as a 2-dimensional scatter plot (1) with all samples having the same marker shape/color; (2) with the marker shape/color for each sample indicating the assigned cluster label for the GMM procedure; (3) with the marker shape/color for each sample indicating the assigned cluster label for 0.4 0.3 the K-Means algorithm. Indicate how you initialized each algorithm. Briefly discuss results 2 Clustering Using GMMs and K-Means Algorithm (30 points) Let g(x: ) indicate the probability density function (pdf) of a Gaussian random vector with mean and covariance matrix . Write code that implements the following . Generate N samples from p(x:0) 1g(x: (8),(H)1+Ag(x:8).Gds))+3g(x(1), (0 9)) Fit a mixture of M = 3 Gaussian pdfs to the data generated in the previous step using the EM algorithm to obtain . Initialize the EM algorithm as you see appropriate but do not use the true model parameters Using the components of the estimated GMM, assign cluster labels to samples, such that the index of the Gaussian component with the largest posterior is assigned to each sample (in the textbook, see Chapter 10, equation 27, on page 526 for the calculation of the posterior probabilities) Using the K-Means clustering algorithm with K = 3, and employing Euclidean distance between centroids and samples to make label assignment updates during iterations, assign cluster labels to each sample. Initialize the centroids as you see appropriate but do not use the true model parameters. Run the code you developed to generate N 100 samples from a GMM with s-) and cluster these samples using both GMM and K-Means procedures. Present your results in the form of three separate plots that show the generated data set as a 2-dimensional scatter plot (1) with all samples having the same marker shape/color; (2) with the marker shape/color for each sample indicating the assigned cluster label for the GMM procedure; (3) with the marker shape/color for each sample indicating the assigned cluster label for 0.4 0.3 the K-Means algorithm. Indicate how you initialized each algorithm. Briefly discuss resultsStep by Step Solution
There are 3 Steps involved in it
Step: 1

Get Instant Access to Expert-Tailored Solutions
See step-by-step solutions with expert insights and AI powered tools for academic success
Step: 2

Step: 3

Ace Your Homework with AI
Get the answers you need in no time with our AI-driven, step-by-step assistance
Get Started


