PLEASE ANSWER IN MATLAB CODE


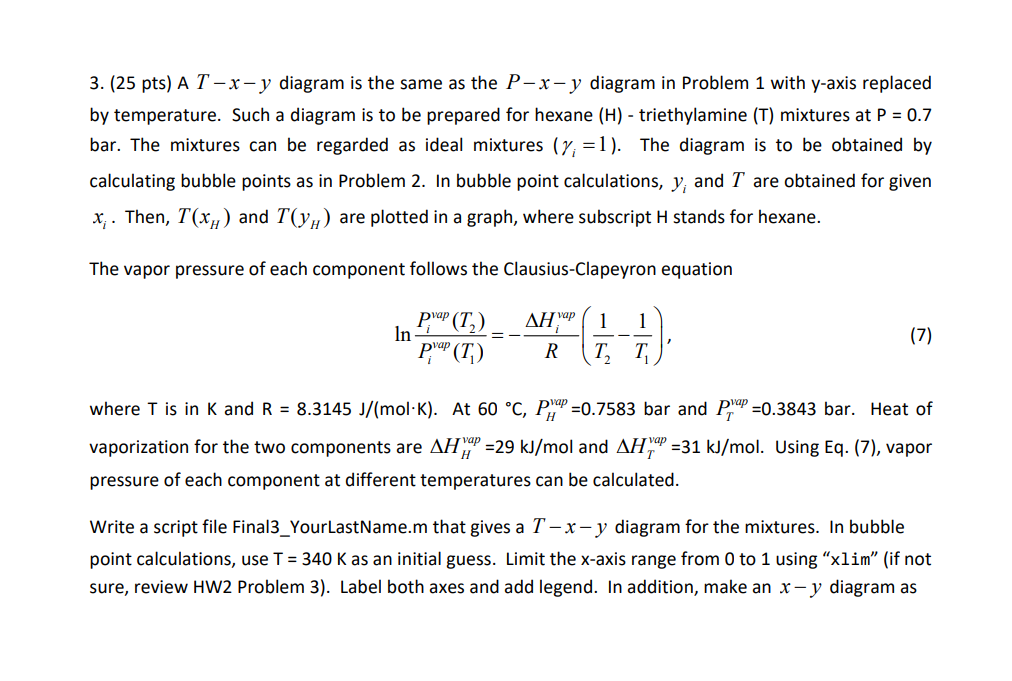
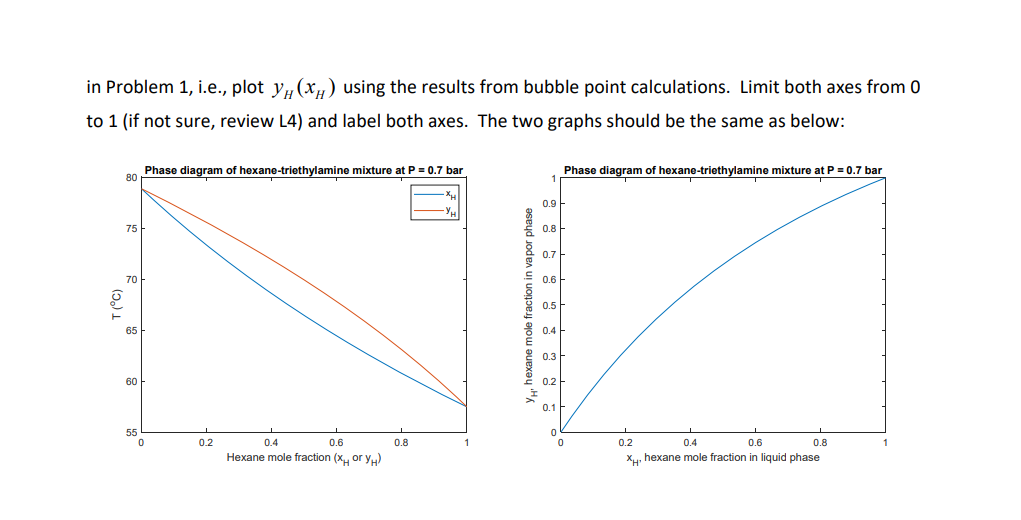
3. (25 pts) A T-x-y diagram is the same as the P-x-y diagram in Problem 1 with y-axis replaced by temperature. Such a diagram is to be prepared for hexane (H) - triethylamine (T) mixtures at P = 0.7 bar. The mixtures can be regarded as ideal mixtures (y; =1). The diagram is to be obtained by calculating bubble points as in Problem 2. In bubble point calculations, y; and I are obtained for given X;. Then, T(xH) and T(Yu) are plotted in a graph, where subscript H stands for hexane. The vapor pressure of each component follows the Clausius-Clapeyron equation AHvap 1 1 pYap (T2) p'ap (T) In (7) R T where T is in K and R = 8.3145 J/(mol-K). At 60 C, P," =0.7583 bar and Pap =0.3843 bar. Heat of vaporization for the two components are AH1 =29 kJ/mol and AH" =31 kJ/mol. Using Eq. (7), vapor pressure of each component at different temperatures can be calculated. Write a script file Final3_YourLastName.m that gives a T -x- y diagram for the mixtures. In bubble point calculations, use T = 340 K as an initial guess. Limit the x-axis range from 0 to 1 using xlim" (if not sure, review HW2 Problem 3). Label both axes and add legend. In addition, make an x - y diagram as in Problem 1, i.e., plot y(xh) using the results from bubble point calculations. Limit both axes from O to 1 (if not sure, review L4) and label both axes. The two graphs should be the same as below: Phase diagram of hexane-triethylamine mixture at P=0.7 bar Phase diagram of hexane-triethylamine mixture at P = 0.7 bar 80 0.9 75 0.8 0.7 70 0.6 T(C) hexane mole fraction in vapor phas 0.5 65 0.4 0.3 60 0.2 0.1 55 0 0 0 0.2 0.8 0.2 0.6 1 0.4 0.6 Hexane mole fraction (xory 0.4 0.8 XH, hexane mole fraction in liquid phase 3. (25 pts) A T-x-y diagram is the same as the P-x-y diagram in Problem 1 with y-axis replaced by temperature. Such a diagram is to be prepared for hexane (H) - triethylamine (T) mixtures at P = 0.7 bar. The mixtures can be regarded as ideal mixtures (y; =1). The diagram is to be obtained by calculating bubble points as in Problem 2. In bubble point calculations, y; and I are obtained for given X;. Then, T(xH) and T(Yu) are plotted in a graph, where subscript H stands for hexane. The vapor pressure of each component follows the Clausius-Clapeyron equation AHvap 1 1 pYap (T2) p'ap (T) In (7) R T where T is in K and R = 8.3145 J/(mol-K). At 60 C, P," =0.7583 bar and Pap =0.3843 bar. Heat of vaporization for the two components are AH1 =29 kJ/mol and AH" =31 kJ/mol. Using Eq. (7), vapor pressure of each component at different temperatures can be calculated. Write a script file Final3_YourLastName.m that gives a T -x- y diagram for the mixtures. In bubble point calculations, use T = 340 K as an initial guess. Limit the x-axis range from 0 to 1 using xlim" (if not sure, review HW2 Problem 3). Label both axes and add legend. In addition, make an x - y diagram as in Problem 1, i.e., plot y(xh) using the results from bubble point calculations. Limit both axes from O to 1 (if not sure, review L4) and label both axes. The two graphs should be the same as below: Phase diagram of hexane-triethylamine mixture at P=0.7 bar Phase diagram of hexane-triethylamine mixture at P = 0.7 bar 80 0.9 75 0.8 0.7 70 0.6 T(C) hexane mole fraction in vapor phas 0.5 65 0.4 0.3 60 0.2 0.1 55 0 0 0 0.2 0.8 0.2 0.6 1 0.4 0.6 Hexane mole fraction (xory 0.4 0.8 XH, hexane mole fraction in liquid phase


