

Question
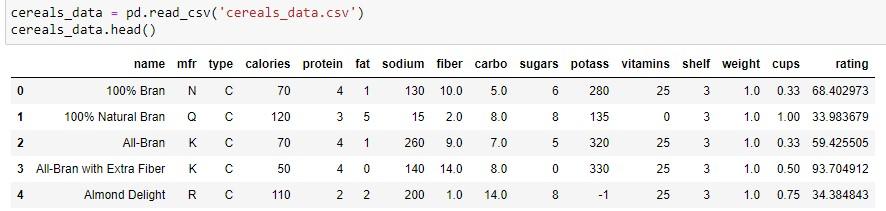
#Please Answer in python Codeblock Read the .csv file cereal_names.csv as a data frame called cereal_names and output the first five rows. Create a new
#Please Answer in python Codeblock
Read the .csv file cereal_names.csv as a data frame called cereal_names and output the first five rows.
Create a new data frame called cereals_data2 that combines (joins) cereals_data with cereal_names horizontally, placing cereal_names on the right. Output the first five rows and last 10 columns to confirm the resulting combined data frame. (Remember that negative indexes wrap around to the end of an array-like structure.)
B)
Read the .csv file more_cereals_data.csv as a data frame called more_cereals_data. As we did with cereals_data.csv, strip the column names of extraneous whitespace, and same for the columns Name, Manuf, and Type.
Output the first five rows to get a look at the data.
Create a new data frame called cereals_data3 that combines (appends) cereals_data2 with more_cereals_data vertically, placing more_cereals_data below cereals_data2. To avoid duplicating indexes, make sure that indexes are ignored when appending.
Output the last 10 rows to confirm the resulting combined data frame. (You should see that Cal, Vit, Calories, and Vitamins are all present since the additional data frame did not use the abbreviated terms you applied earlier. This is an intentional result.)
C) Check for any missing values in `cereals_data3` by computing for each column how many values are null.
Iterate over the columns of cereals_data3. For each numeric column, fill in the missing (null) values of the column with the column's mean. For each categorical (non-numeric) column, fill in the missing values using the "forward fill" method.
To check if a column's data type is numeric, you may import the top-level function is_numeric_dtype and provide a specific column. The import statement is provided below:
from pandas.api.types import is_numeric_dtype
D)
Pandas provides two types of "cut" methods. One is cut and the other qcut. cut will separate data (such as a column in a DataFrame) into bins based on the values of the data, where the bins are equally spaced. qcut will separate the data into bins such that each bin has (roughly) equal number of entities in each bin. For example, a normal bell-curved dataset split into 3 bins should have most values placed in the middle bin when using cut, whereas qcut using a value of 3 for q ("q" referring to the more common "quartile" with a value of 4) would instead adjuct the range of each bin to make it so each one has almost equal number of values.
Use the Cal column of cereals_data3 to demonstrate this difference. Cut the data using cut with 3 bins and the labels low, moderate, and high. Do the same thing with qcut with the same labels and a value of 3 for q. Print out the value_counts() table for each type of cut to see the results.
Combine the two counts of each cut into a single data frame with one column called cut and the other qcut, each with counts for the three labels. Then plot a histogram / bar graph displaying the counts side-by-side on the same graph.
E)
Write a method called standardize that takes in a data frame and a list of columns. The method should create and return a data frame that contains only the numeric columns from the given data frame that are provided in the columns list, but in a standardized form. (You may find it easiest to start with an initially empty data frame and add columns to it.) This standardized form is called a "z-score" and can be computed as follows:
=z=xxs
where x is the original value, x is the mean of the values in that column, and s is the standard deviation of values in that column.
Call standardize by giving it the cereals_data3 data frame and the columns Carbo, Sugars, Potass, Vit, and Name. (Name is not a numeric column, so it should not show up in the resulting data frame, nor should it cause an error.) Using this standardized data frame, check for outliers by finding any values that are greater than 3. Output for a each column a count of the number of outliers in that column.
cereals_data pd.read_csv('cereals_data.csv') cereals_data.head() 3 8 3 name mfr type calories protein fat sodium fiber carbo sugars potass vitamins shelf weight cups rating 0 100% Bran N 70 4 1 130 10.0 5.0 6 280 25 3 1.0 0.33 68.402973 1 100% Natural Bran Q 120 3 5 15 2.0 8.0 135 0 3 1.0 1.00 33.983679 2 All Bran K 70 4 1 260 9.0 7.0 5 320 25 3 1.0 0.33 59.425505 3 All-Bran with Extra Fiber K 4 0 140 14.0 8.0 0 330 25 3 1.0 0.50 93.704912 4 Almond Delight R 110 2 2 200 1.0 14.0 8 25 3 1.0 0.75 34.384843 50 c 2 2 -1Step by Step Solution
There are 3 Steps involved in it
Step: 1

Get Instant Access to Expert-Tailored Solutions
See step-by-step solutions with expert insights and AI powered tools for academic success
Step: 2

Step: 3
Ace Your Homework with AI
Get the answers you need in no time with our AI-driven, step-by-step assistance
Get Started
Time Series Databases New Ways To Store And Access Data
Authors: Ted Dunning, Ellen Friedman
1st Edition
1491914726, 978-1491914724