Answered step by step
Verified Expert Solution
Link Copied!

Question

1 Approved Answer

Please answer last part Homework: Chapter 3 Homework Score: 1.67 of 5 pts 15 of 10 (5 3.2.17 The following data represent exam scores in

Please answer last part
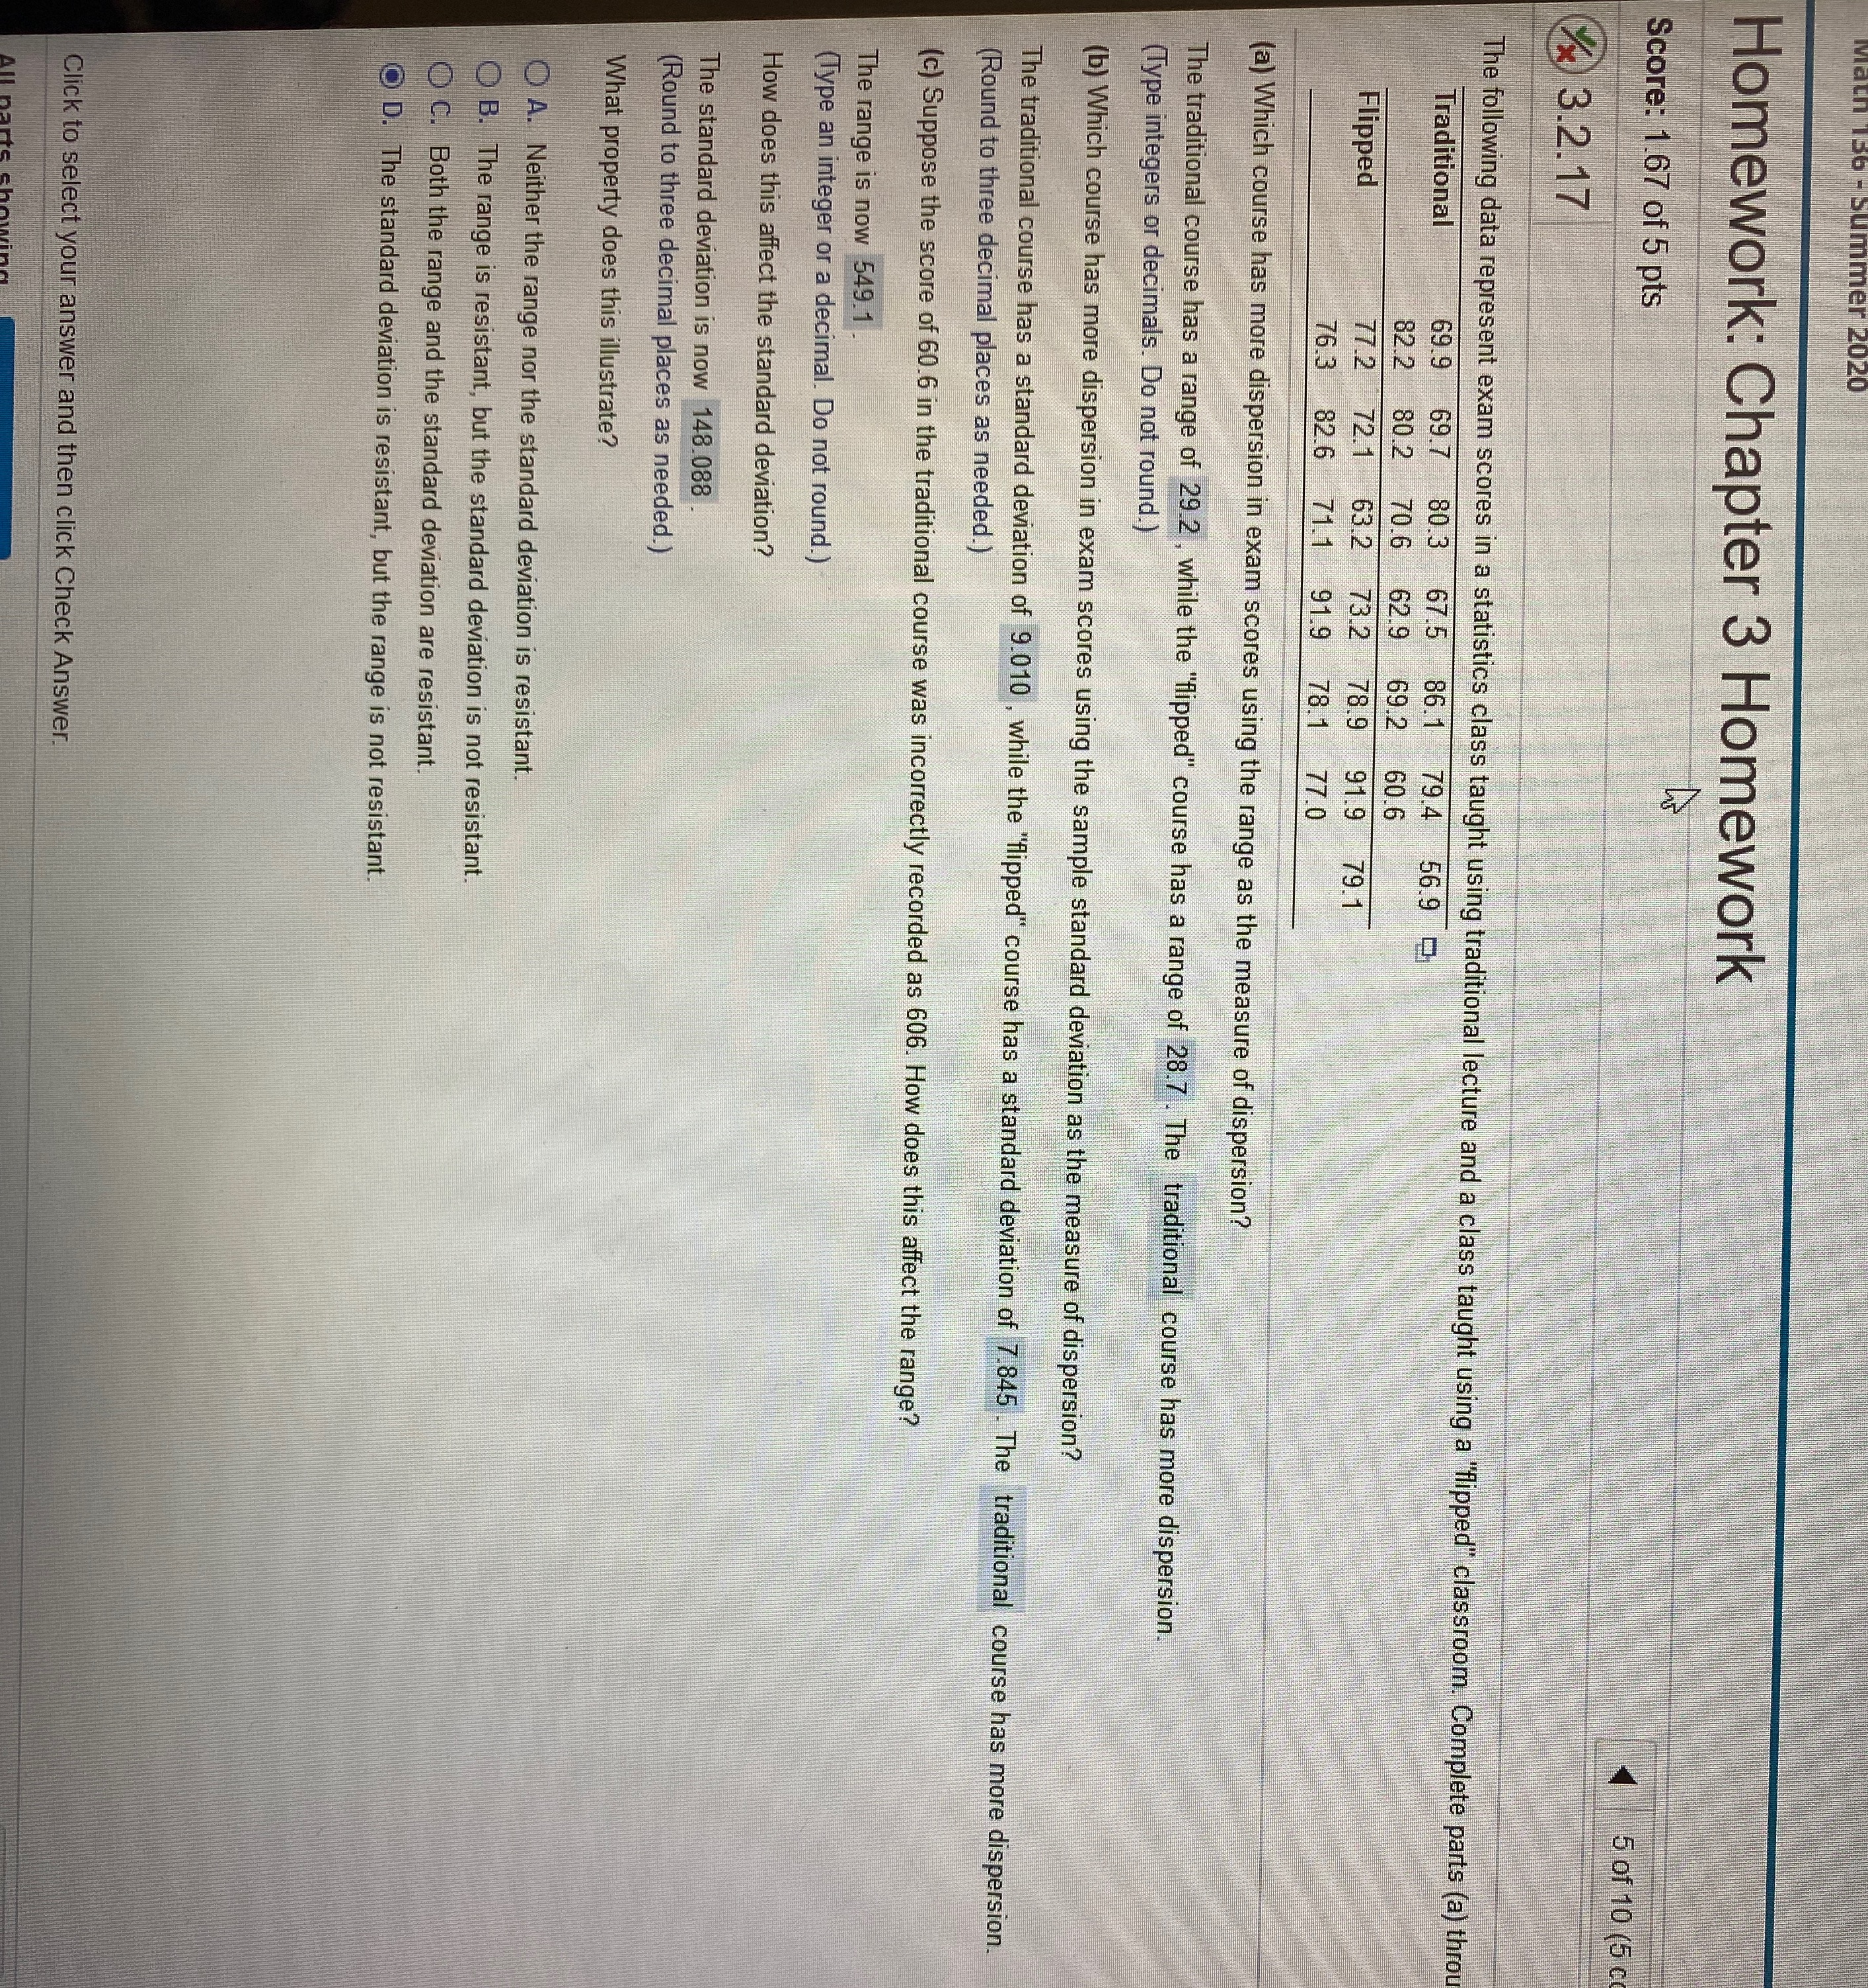
image text in transcribed
Homework: Chapter 3 Homework Score: 1.67 of 5 pts 15 of 10 (5 3.2.17 The following data represent exam scores in a statistics class taught using traditional lecture and a class taught using a "flipped" classroom. Complete parts (a) thro Traditional 69.9 69.7 80.3 67.5 86.1 79.4 569 82.2 80.2 70.6 62.9 69.2 60.6 Flipped 77.2 72.1 63.2 73.2 78.9 91.9 79.1 76.3 82.6 71.1 91.9 78.1 77.0 (a) Which course has more dispersion in exam scores using the range as the measure of dispersion? The traditional course has a range of 29.2 , while the "flipped" course has a range of 28.7 . The traditional course has more dispersion. (Type integers or decimals. Do not round.) (b) Which course has more dispersion in exam scores using the sample standard deviation as the measure of dispersion? The traditional course has a standard deviation of 9.010 , while the "flipped" course has a standard deviation of 7.845 . The traditional course has more dispersion. (Round to three decimal places as needed.) (c) Suppose the score of 60.6 in the traditional course was incorrectly recorded as 606. How does this affect the range? The range is now 549.1 (Type an integer or a decimal. Do not round.) How does this affect the standard deviation? The standard deviation is now 148.088 (Round to three decimal places as needed. ) What property does this illustrate? A. Neither the range nor the standard deviation is resistant. O B. The range is resistant, but the standard deviation is not resistant. O C. Both the range and the standard deviation are resistant . O D. The standard deviation is resistant, but the range is not resistant. Click to select your answer and then click Check

Step by Step Solution

There are 3 Steps involved in it

Step: 1

blur-text-image

Get Instant Access to Expert-Tailored Solutions

See step-by-step solutions with expert insights and AI powered tools for academic success

Step: 2

blur-text-image

Step: 3

blur-text-image

Ace Your Homework with AI

Get the answers you need in no time with our AI-driven, step-by-step assistance

Get Started

Recommended Textbook for

Quantitative Analysis For Management

Authors: Barry Render, Ralph M. Stair, Michael E. Hanna

11th Edition

9780132997621, 132149117, 132997622, 978-0132149112

Students also viewed these Mathematics questions