 Please answer more detail
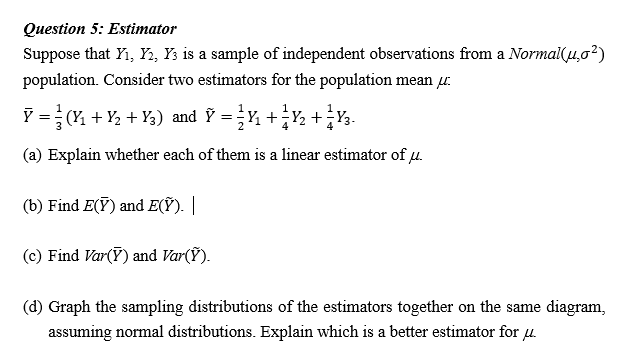
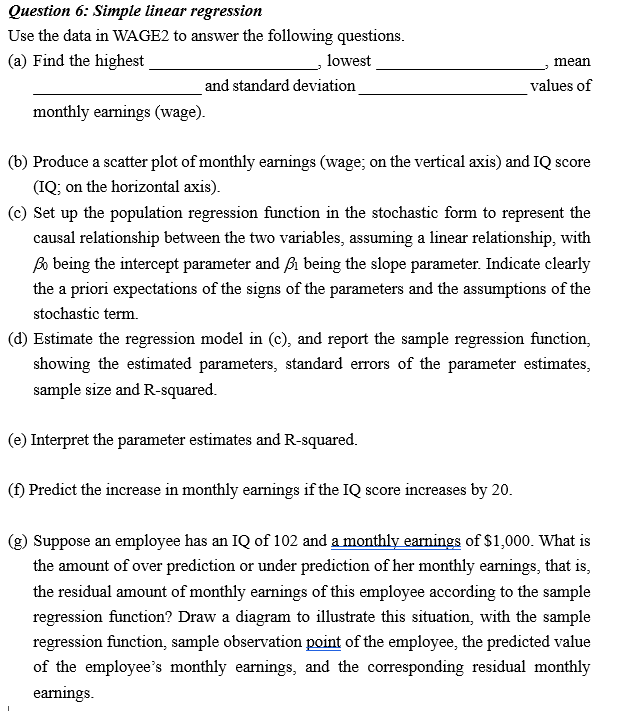
Question 5: Estimator Suppose that Y1,Y2,Y3 is a sample of independent observations from a Normal(,2) population. Consider two estimators for the population mean : Y=31(Y1+Y2+Y3) and Y~=21Y1+41Y2+41Y3. (a) Explain whether each of them is a linear estimator of . (b) Find E(Y) and E(Y~). (c) Find Var(Y) and Var(Y~) (d) Graph the sampling distributions of the estimators together on the same diagram, assuming normal distributions. Explain which is a better estimator for . Question 6: Simple linear regression Use the data in WAGE2 to answer the following questions. (a) Find the highest lowest . , mean values of monthly earnings (wage). (b) Produce a scatter plot of monthly earnings (wage; on the vertical axis) and IQ score (IQ; on the horizontal axis). (c) Set up the population regression function in the stochastic form to represent the causal relationship between the two variables, assuming a linear relationship, with 0 being the intercept parameter and 1 being the slope parameter. Indicate clearly the a priori expectations of the signs of the parameters and the assumptions of the stochastic term. (d) Estimate the regression model in (c), and report the sample regression function, showing the estimated parameters, standard errors of the parameter estimates, sample size and R-squared. (e) Interpret the parameter estimates and R-squared. (f) Predict the increase in monthly earnings if the IQ score increases by 20. (g) Suppose an employee has an IQ of 102 and a monthly earnings of $1,000. What is the amount of over prediction or under prediction of her monthly earnings, that is, the residual amount of monthly earnings of this employee according to the sample regression function? Draw a diagram to illustrate this situation, with the sample regression function, sample observation point of the employee, the predicted value of the employee's monthly earnings, and the corresponding residual monthly earnings. Question 5: Estimator Suppose that Y1,Y2,Y3 is a sample of independent observations from a Normal(,2) population. Consider two estimators for the population mean : Y=31(Y1+Y2+Y3) and Y~=21Y1+41Y2+41Y3. (a) Explain whether each of them is a linear estimator of . (b) Find E(Y) and E(Y~). (c) Find Var(Y) and Var(Y~) (d) Graph the sampling distributions of the estimators together on the same diagram, assuming normal distributions. Explain which is a better estimator for . Question 6: Simple linear regression Use the data in WAGE2 to answer the following questions. (a) Find the highest lowest . , mean values of monthly earnings (wage). (b) Produce a scatter plot of monthly earnings (wage; on the vertical axis) and IQ score (IQ; on the horizontal axis). (c) Set up the population regression function in the stochastic form to represent the causal relationship between the two variables, assuming a linear relationship, with 0 being the intercept parameter and 1 being the slope parameter. Indicate clearly the a priori expectations of the signs of the parameters and the assumptions of the stochastic term. (d) Estimate the regression model in (c), and report the sample regression function, showing the estimated parameters, standard errors of the parameter estimates, sample size and R-squared. (e) Interpret the parameter estimates and R-squared. (f) Predict the increase in monthly earnings if the IQ score increases by 20. (g) Suppose an employee has an IQ of 102 and a monthly earnings of $1,000. What is the amount of over prediction or under prediction of her monthly earnings, that is, the residual amount of monthly earnings of this employee according to the sample regression function? Draw a diagram to illustrate this situation, with the sample regression function, sample observation point of the employee, the predicted value of the employee's monthly earnings, and the corresponding residual monthly earnings

 Please answer more detail


