 PLEASE ANSWER ONLY NUMBER 10 PLEASE
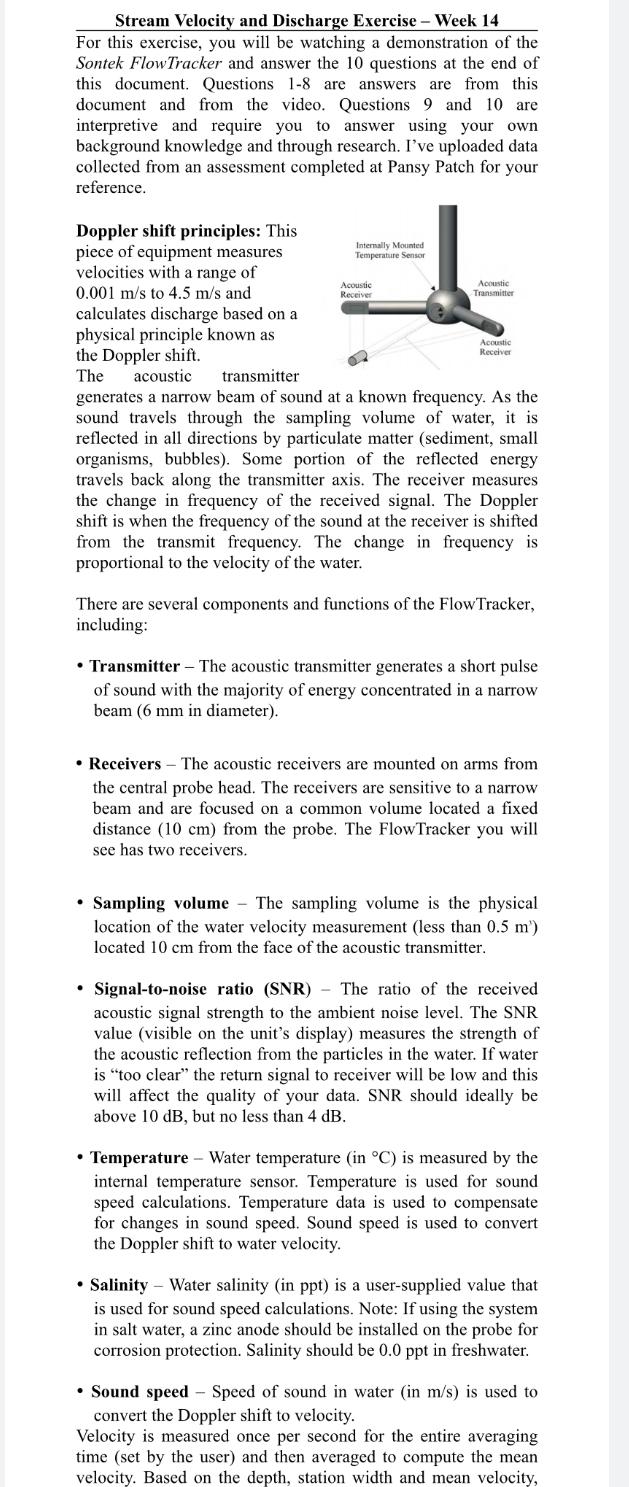
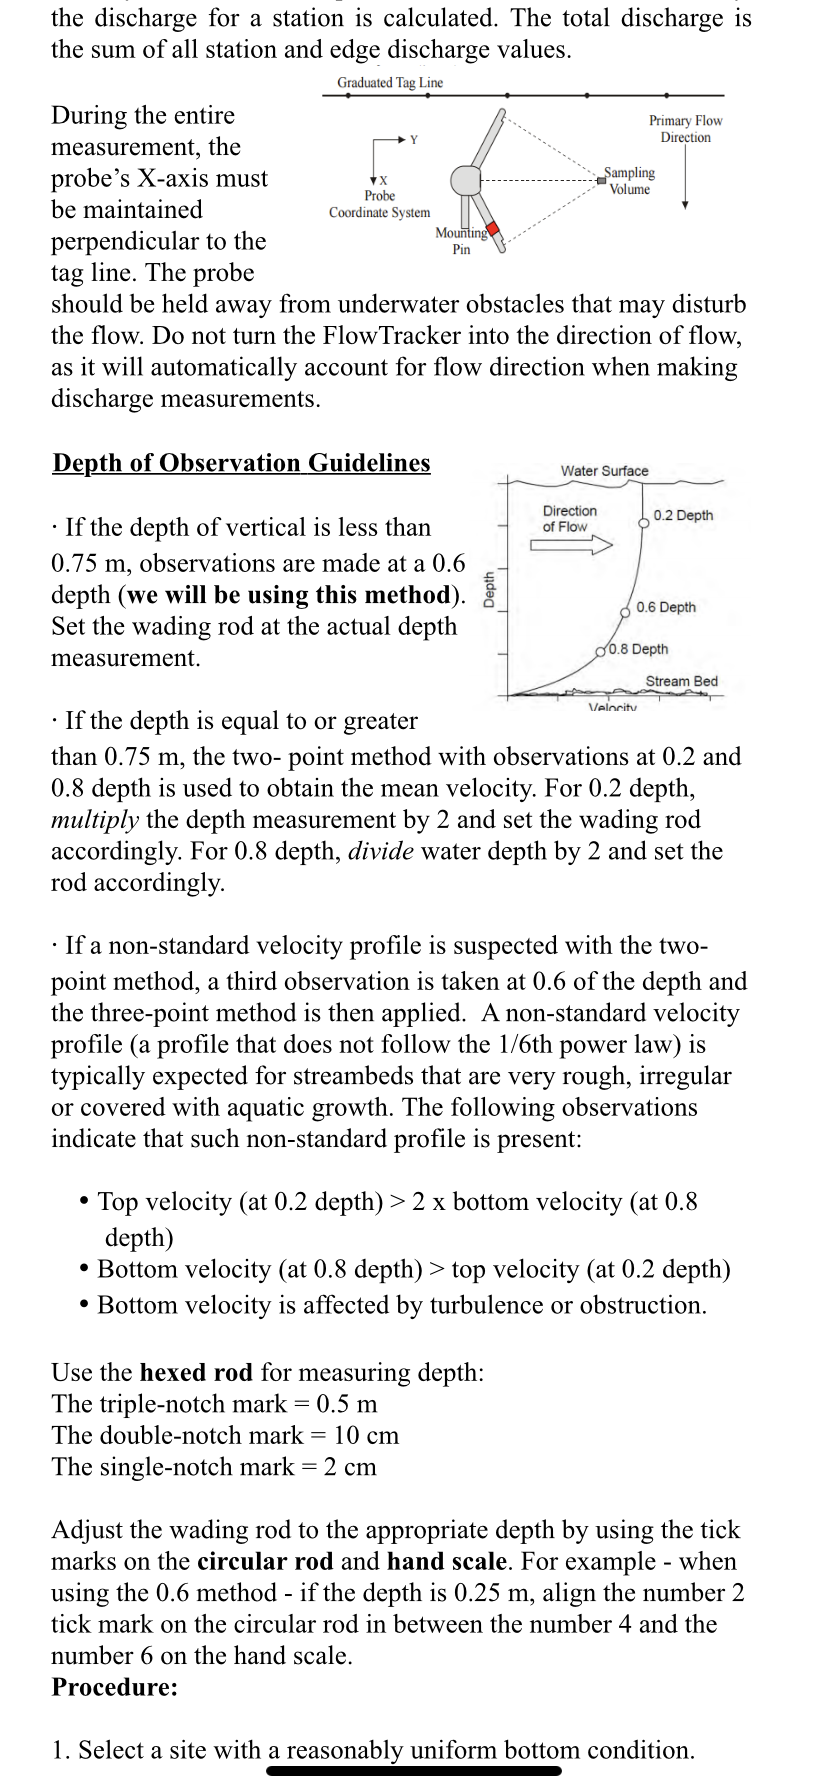
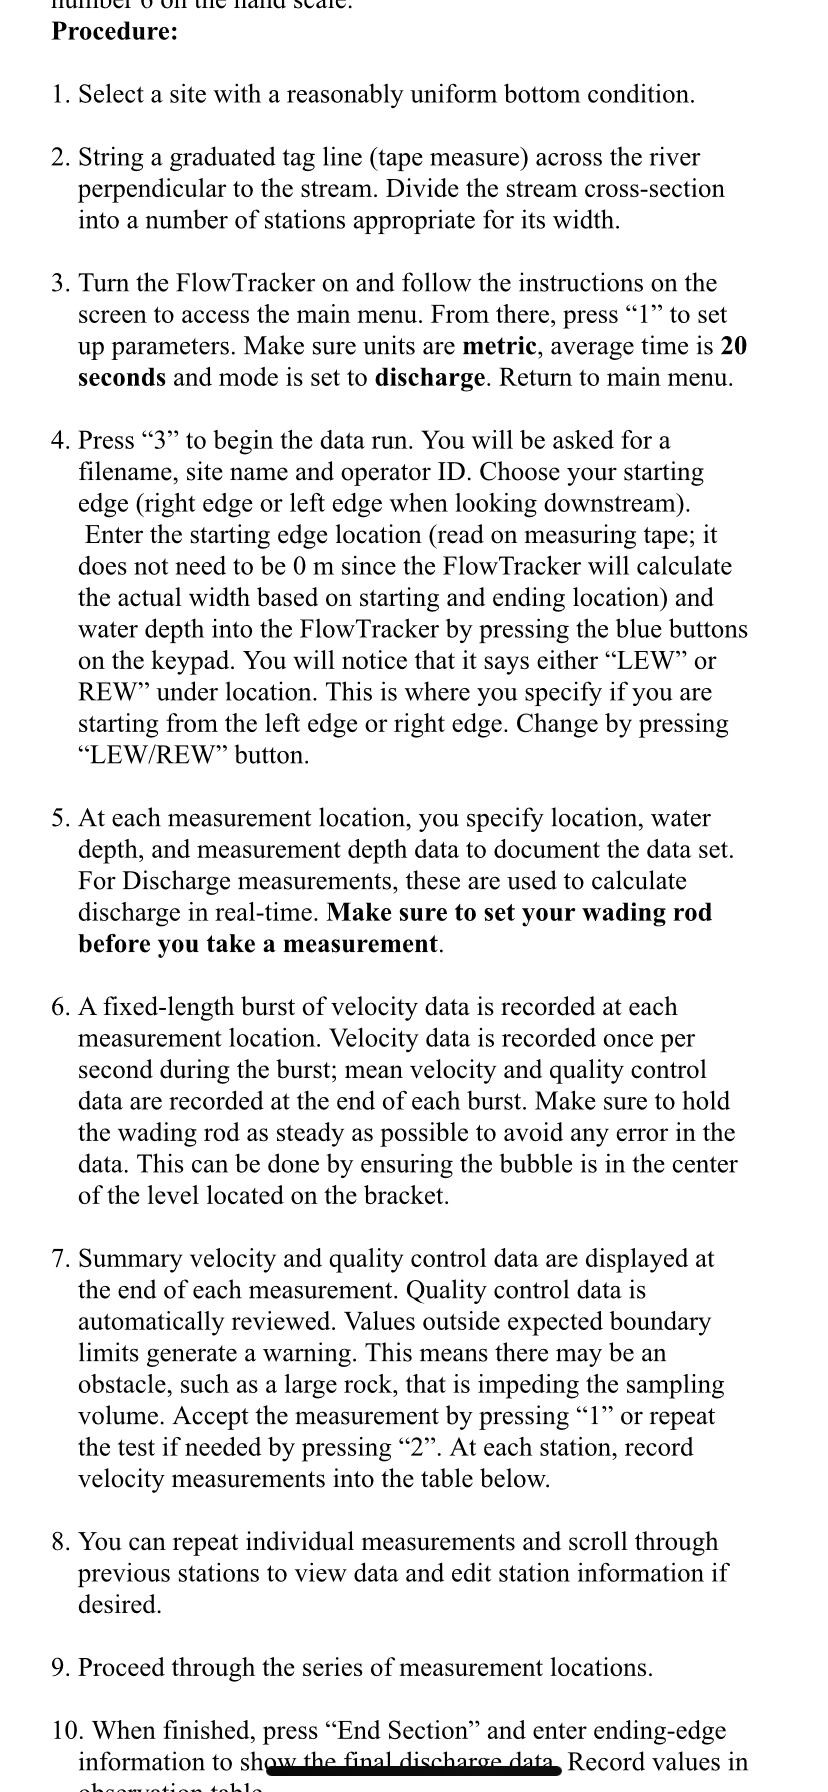
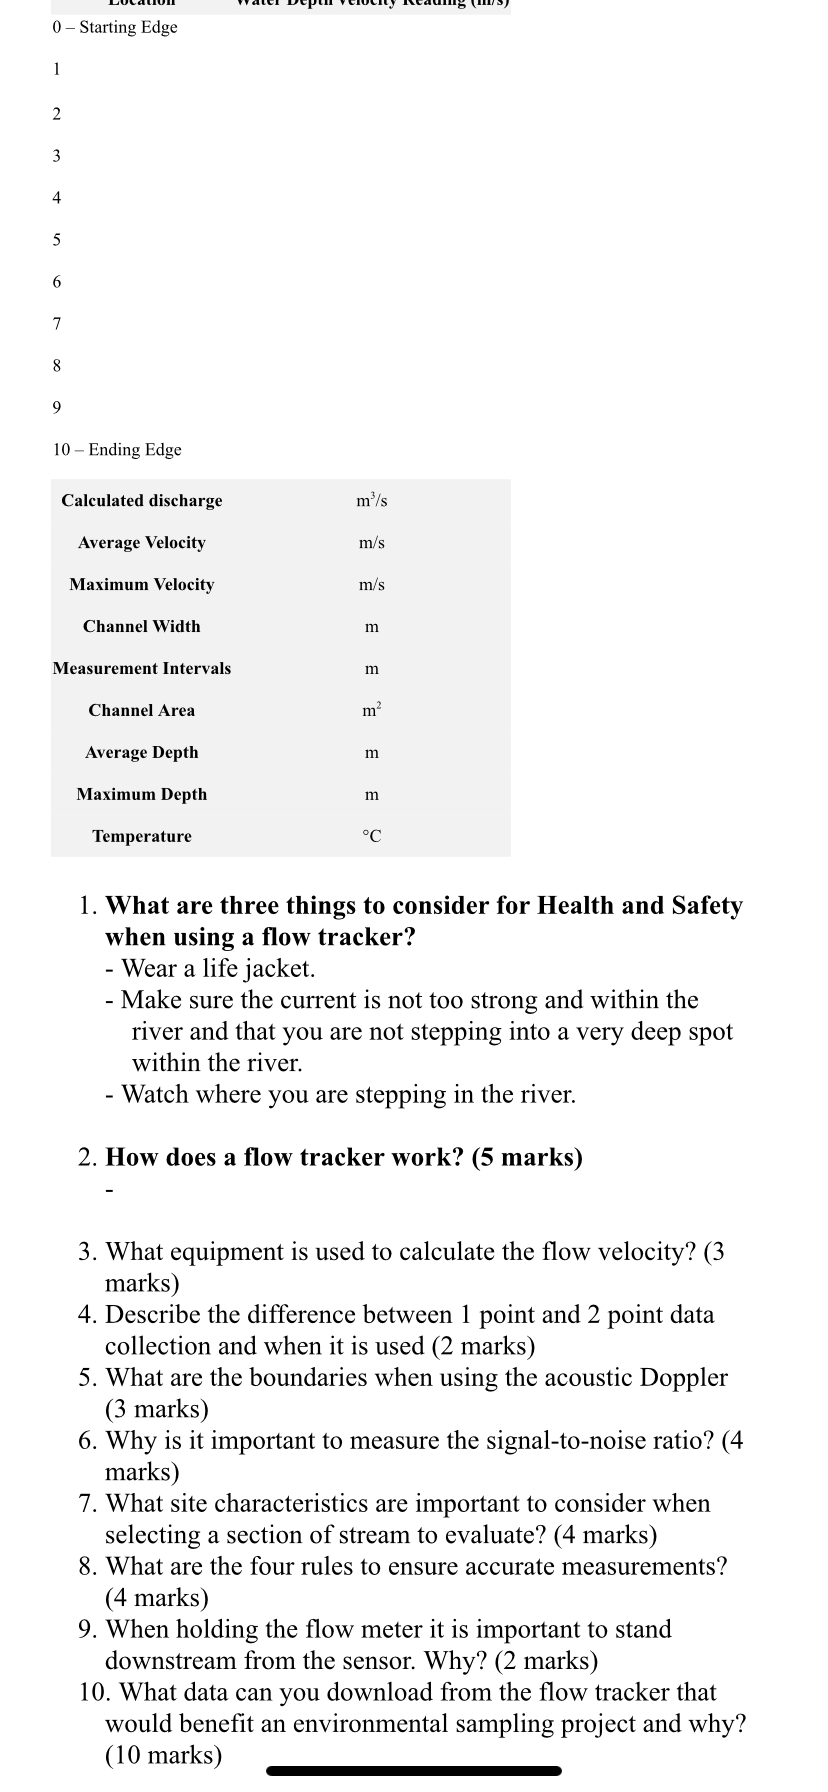
Stream Velocity and Discharge Exercise - Week 14 For this exercise, you will be watching a demonstration of the Sontek FlowTracker and answer the 10 questions at the end of this document. Questions 1-8 are answers are from this document and from the video. Questions 9 and 10 are interpretive and require you to answer using your own background knowledge and through research. I've uploaded data collected from an assessment completed at Pansy Patch for your reference. Internally Mounted Temperature Sensor Acoustic Receiver Acoustic Transmitter Acoustic Receiver Doppler shift principles: This piece of equipment measures velocities with a range of 0.001 m/s to 4.5 m/s and calculates discharge based on a physical principle known as the Doppler shift. The acoustic transmitter generates a narrow beam of sound at a known frequency. As the sound travels through the sampling volume of water, it is reflected in all directions by particulate matter (sediment, small organisms, bubbles). Some portion of the reflected energy travels back along the transmitter axis. The receiver measures the change in frequency of the received signal. The Doppler shift is when the frequency of the sound at the receiver is shifted from the transmit frequency. The change in frequency is proportional to the velocity of the water. There are several components and functions of the Flow Tracker, including: Transmitter - The acoustic transmitter generates a short pulse of sound with the majority of energy concentrated in a narrow beam (6 mm in diameter). Receivers - The acoustic receivers are mounted on arms from the central probe head. The receivers are sensitive to a narrow beam and are focused on a common volume located a fixed distance (10 cm) from the probe. The Flow Tracker you will see has two receivers. Sampling volume - The sampling volume is the physical location of the water velocity measurement (less than 0.5 m) located 10 cm from the face of the acoustic transmitter. Signal-to-noise ratio (SNR) - The ratio of the received acoustic signal strength to the ambient noise level. The SNR value (visible on the unit's display) measures the strength of the acoustic reflection from the particles in the water. If water is "too clear the return signal to receiver will be low and this will affect the quality of your data. SNR should ideally be above 10 dB, but no less than 4 dB. Temperature - Water temperature (in C) is measured by the internal temperature sensor. Temperature is used for sound speed calculations. Temperature data is used to compensate for changes in sound speed. Sound speed is used to convert the Doppler shift to water velocity. Salinity - Water salinity (in ppt) is a user-supplied value that is used for sound speed calculations. Note: If using the system in salt water, a zinc anode should be installed on the probe for corrosion protection. Salinity should be 0.0 ppt in freshwater. Sound speed - Speed of sound in water (in m/s) is used to convert the Doppler shift to velocity. Velocity is measured once per second for the entire averaging time (set by the user) and then averaged to compute the mean velocity. Based on the depth, station width and mean velocity, the discharge for a station is calculated. The total discharge is the sum of all station and edge discharge values. Graduated Tag Line Primary Flow Direction Y Volume X Probe Coordinate System Pin During the entire measurement, the probe's X-axis must Sampling be maintained Mounting perpendicular to the tag line. The probe should be held away from underwater obstacles that may disturb the flow. Do not turn the FlowTracker into the direction of flow, as it will automatically account for flow direction when making discharge measurements. Depth of Observat Guidelin Water Surface Direction of Flow 0.2 Depth If the depth of vertical is less than 0.75 m, observations are made at a 0.6 depth (we will be using this method). Set the wading rod at the actual depth measurement. 0.6 Depth 0.8 Depth Stream Bed Velocity If the depth is equal to or greater than 0.75 m, the two- point method with observations at 0.2 and 0.8 depth is used to obtain the mean velocity. For 0.2 depth, multiply the depth measurement by 2 and set the wading rod accordingly. For 0.8 depth, divide water depth by 2 and set the rod accordingly. If a non-standard velocity profile is suspected with the two- point method, a third observation is taken at 0.6 of the depth and the three-point method is then applied. A non-standard velocity profile (a profile that does not follow the 1/6th power law) is typically expected for streambeds that are very rough, irregular or covered with aquatic growth. The following observations indicate that such non-standard profile is present: Top velocity (at 0.2 depth) > 2 x bottom velocity (at 0.8 depth) Bottom velocity (at 0.8 depth) > top velocity (at 0.2 depth) Bottom velocity is affected by turbulence or obstruction. Use the hexed rod for measuring depth: The triple-notch mark = 0.5 m The double-notch mark = 10 cm The single-notch mark = 2 cm - Adjust the wading rod to the appropriate depth by using the tick marks on the circular rod and hand scale. For example - when using the 0.6 method - if the depth is 0.25 m, align the number 2 tick mark on the circular rod in between the number 4 and the number 6 on the hand scale. Procedure: 1. Select a site with a reasonably uniform bottom condition. Procedure: 1. Select a site with a reasonably uniform bottom condition. 2. String a graduated tag line (tape measure) across the river perpendicular to the stream. Divide the stream cross-section into a number of stations appropriate for its width. 3. Turn the Flow Tracker on and follow the instructions on the screen to access the main menu. From there, press 1 to set up parameters. Make sure units are metric, average time is 20 seconds and mode is set to discharge. Return to main menu. 4. Press 3 to begin the data run. You will be asked for a filename, site name and operator ID. Choose your starting edge (right edge or left edge when looking downstream). Enter the starting edge location (read on measuring tape; it does not need to be 0 m since the Flow Tracker will calculate the actual width based on starting and ending location) and water depth into the FlowTracker by pressing the blue buttons on the keypad. You will notice that it says either LEW or REW under location. This is where you specify if you are starting from the left edge or right edge. Change by pressing LEW/REW button. 5. At each measurement location, you specify location, water depth, and measurement depth data to document the data set. For Discharge measurements, these are used to calculate discharge in real-time. Make sure to set your wading rod before you take a measurement. 6. A fixed-length burst of velocity data is recorded at each measurement location. Velocity data is recorded once per second during the burst; mean velocity and quality control data are recorded at the end of each burst. Make sure to hold the wading rod as steady as possible to avoid any error in the data. This can be done by ensuring the bubble is in the center of the level located on the bracket. 7. Summary velocity and quality control data are displayed at the end of each measurement. Quality control data is automatically reviewed. Values outside expected boundary limits generate a warning. This means there may be an obstacle, such as a large rock, that is impeding the sampling volume. Accept the measurement by pressing 1 or repeat the test if needed by pressing 2. At each station, record velocity measurements into the table below. 8. You can repeat individual measurements and scroll through previous stations to view data and edit station information if desired. 9. Proceed through the series of measurement locations. 10. When finished, press "End Section and enter ending-edge information to show the final discharge data Record values in bi 0 - Starting Edge 1 2 3 4 5 6 7 8 9 10 - Ending Edge Calculated discharge m/s Average Velocity m/s Maximum Velocity m/s Channel Width m Measurement Intervals m Channel Area m Average Depth m Maximum Depth m Temperature C 1. What are three things to consider for Health and Safety when using a flow tracker? - Wear a life jacket. - Make sure the current is not too strong and within the river and that you are not stepping into a very deep spot within the river. Watch where you are stepping in the river. 2. How does a flow tracker work? (5 marks) 3. What equipment is used to calculate the flow velocity? (3 marks) 4. Describe the difference between 1 point and 2 point data collection and when it is used (2 marks) 5. What are the boundaries when using the acoustic Doppler (3 marks) 6. Why is it important to measure the signal-to-noise ratio? (4 marks) 7. What site characteristics are important to consider when selecting a section of stream to evaluate? (4 marks) 8. What are the four rules to ensure accurate measurements? (4 marks) 9. When holding the flow meter it is important to stand downstream from the sensor. Why? (2 marks) 10. What data can you download from the flow tracker that would benefit an environmental sampling project and why? (10 marks)