Answered step by step
Verified Expert Solution
Question
1 Approved Answer
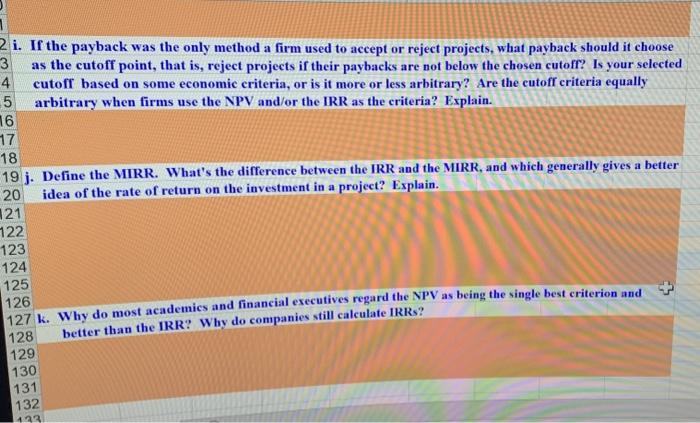
please answer only the three word questions in the first picture. thank you! i. If the payback was the only method a firm used to
please answer only the three word questions in the first picture. thank you! 


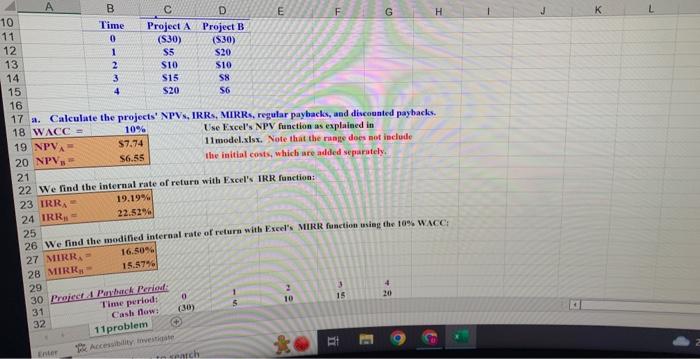
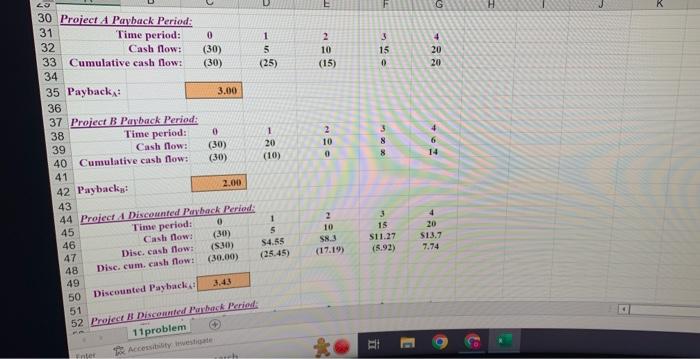
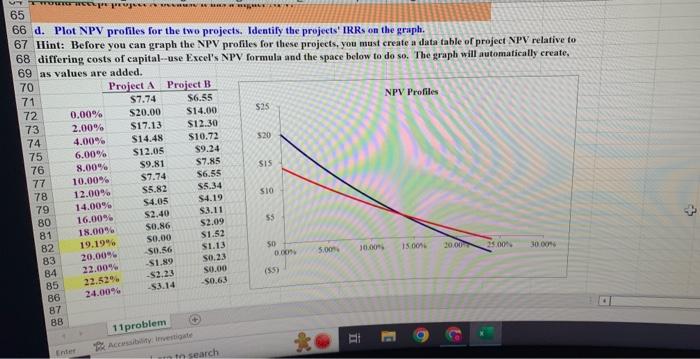
i. If the payback was the only method a firm used to accept or reject projects, what payback should it choose as the cutoff point, that is, reject projects if their paybacks are not below the chosen cutoff? Is your selectec cutoff based on some economic criteria, or is it more or less arbitrary? Are the cutoff criteria equally arbitrary when firms use the NPV and/or the IRR as the criteria? Explain. j. Define the MIRR. What's the difference between the IRR and the MIRR, and which generally gives a better idea of the rate of return on the investment in a project? Explain. k. Why do most academics and financial executives regard the NPV as being the single best criterion and better than the IRR? Why do companies still calculate IRRs? a. Calculate the projects' NPVs, IRRs, MIIRRs, regular paybacks, and discounted paybacks. Lse Kxcel's NPV function as explained in 11 model.xlsx, Note that the runge does not include the initial costs, which are adided separately, W/a find the internal rate of reture with Excel's IRR fanction: 24 the initial costs, whichare 30 Project A Payback Period: 3132333435TiCumulativePaybackA: 0(30)(30)15(25)210(15)315042020 36 37 Proiect B Parback Period: \begin{tabular}{|r|cccccc} \hline 38 & Time period: & 0 & 1 & 2 & 3 & 4 \\ \hline 39 & Cash flow: & (30) & 20 & 10 & 8 & 6 \\ \hline 40 & Cumulative cash flow: & (30) & (10) & 0 & 8 & 14 \end{tabular} 43 44 Project i Discounted Parback Period: 48 49 50 Discounted Paybackst 3.43 51 Project B Discomanted Parbask Period: 11 problem d. Plot NPV profiles for the two projects. Identify the projects' IRRs on the graph. Hint: Before you can graph the NPV profiles for these projects, you must create an data table of project NPV relative to differing costs of capital-use Excel's NPV formula and the space below to do so. The graph will automatically create 


Step by Step Solution
There are 3 Steps involved in it
Step: 1

Get Instant Access to Expert-Tailored Solutions
See step-by-step solutions with expert insights and AI powered tools for academic success
Step: 2

Step: 3

Ace Your Homework with AI
Get the answers you need in no time with our AI-driven, step-by-step assistance
Get Started


