Answered step by step
Verified Expert Solution
Question
1 Approved Answer
please answer part A and part B. I will upvote if answered correctly and shown the work. your work, answer all parts of the question,
please answer part A and part B. I will upvote if answered correctly and shown the work. 


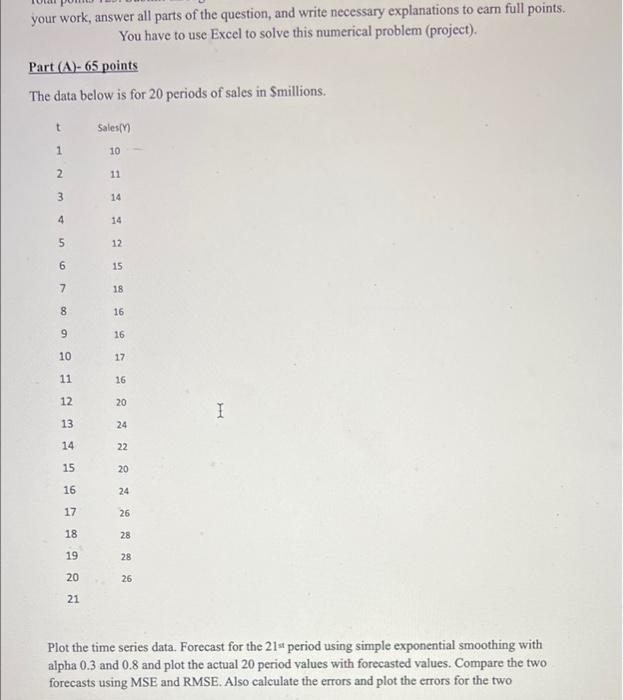
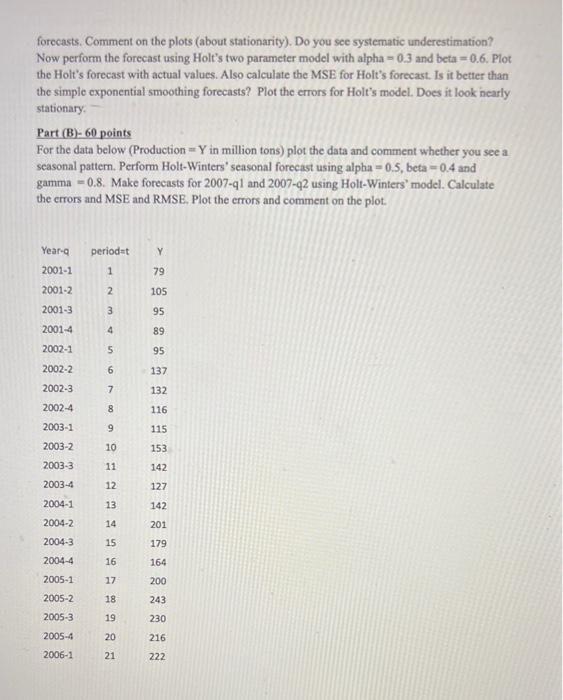
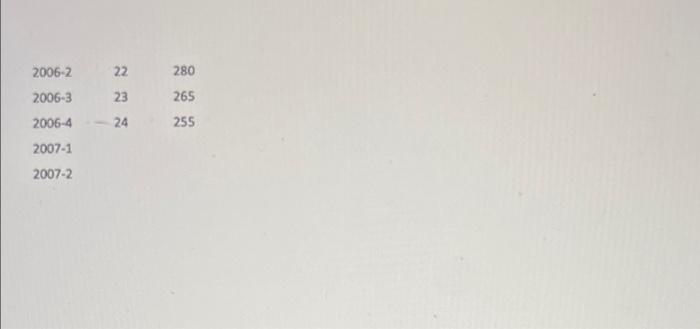
your work, answer all parts of the question, and write necessary explanations to earn full points. You have to use Excel to solve this numerical problem (project). Part (A)- 65 points The data below is for 20 periods of sales in Smillions. t Sales/ 1 10 2 11 3 14 4 14 5 12 6 15 7 18 8 16 9 16 10 17 11 16 12 20 I 13 24 14 22 15 20 16 24 17 26 18 28 19 28 20 26 21 Plot the time series data. Forecast for the 21st period using simple exponential smoothing with alpha 0.3 and 0.8 and plot the actual 20 period values with forecasted values. Compare the two forecasts using MSE and RMSE. Also calculate the errors and plot the errors for the two forecasts. Comment on the plots (about stationarity). Do you see systematic underestimation? Now perform the forecast using Holt's two parameter model with alpha=0.3 and beta=0.6. Plot the Holt's forecast with actual values. Also calculate the MSE for Holt's forecast. Is it better than the simple exponential smoothing forecasts? Plot the errors for Holt's model. Does it look nearly stationary Part (B)- 60 points For the data below (Production = Y in million tons) plot the data and comment whether you see a seasonal pattern. Perform Holt-Winters' seasonal forecast using alpha=0.5, beta -0.4 and gamma=0.8. Make forecasts for 2007-91 and 2007-22 using Holt-Winters' model. Calculate the errors and MSE and RMSE. Plot the errors and comment on the plot. periodat Y 1 79 Year 2001-1 2001-2 2001-3 2 105 3 95 2001-4 4 89 2002-1 5 95 2002-2 6 137 2002-3 7 132 2002-4 8 116 2003-1 115 2003-2 10 153 2003-3 11 142 2003-4 12 127 2004-1 13 142 2004-2 14 201 15 179 2004-3 2004-4 16 164 2005-1 17 200 2005-2 18 243 2005-3 19 230 20 216 2005-4 2006-1 21 222 2006-2 22 280 23 2006-3 2006-4 265 255 24 2007-1 2007-2 your work, answer all parts of the question, and write necessary explanations to earn full points. You have to use Excel to solve this numerical problem (project). Part (A)- 65 points The data below is for 20 periods of sales in Smillions. t Sales/ 1 10 2 11 3 14 4 14 5 12 6 15 7 18 8 16 9 16 10 17 11 16 12 20 I 13 24 14 22 15 20 16 24 17 26 18 28 19 28 20 26 21 Plot the time series data. Forecast for the 21st period using simple exponential smoothing with alpha 0.3 and 0.8 and plot the actual 20 period values with forecasted values. Compare the two forecasts using MSE and RMSE. Also calculate the errors and plot the errors for the two forecasts. Comment on the plots (about stationarity). Do you see systematic underestimation? Now perform the forecast using Holt's two parameter model with alpha=0.3 and beta=0.6. Plot the Holt's forecast with actual values. Also calculate the MSE for Holt's forecast. Is it better than the simple exponential smoothing forecasts? Plot the errors for Holt's model. Does it look nearly stationary Part (B)- 60 points For the data below (Production = Y in million tons) plot the data and comment whether you see a seasonal pattern. Perform Holt-Winters' seasonal forecast using alpha=0.5, beta -0.4 and gamma=0.8. Make forecasts for 2007-91 and 2007-22 using Holt-Winters' model. Calculate the errors and MSE and RMSE. Plot the errors and comment on the plot. periodat Y 1 79 Year 2001-1 2001-2 2001-3 2 105 3 95 2001-4 4 89 2002-1 5 95 2002-2 6 137 2002-3 7 132 2002-4 8 116 2003-1 115 2003-2 10 153 2003-3 11 142 2003-4 12 127 2004-1 13 142 2004-2 14 201 15 179 2004-3 2004-4 16 164 2005-1 17 200 2005-2 18 243 2005-3 19 230 20 216 2005-4 2006-1 21 222 2006-2 22 280 23 2006-3 2006-4 265 255 24 2007-1 2007-2 


Step by Step Solution
There are 3 Steps involved in it
Step: 1

Get Instant Access to Expert-Tailored Solutions
See step-by-step solutions with expert insights and AI powered tools for academic success
Step: 2

Step: 3

Ace Your Homework with AI
Get the answers you need in no time with our AI-driven, step-by-step assistance
Get Started


