

Answered step by step
Verified Expert Solution
Question
1 Approved Answer
Please answer part B. To Do a. Create a spreadsheet similar to Table 3.10 to model the following: 1. A multiple-step comparative income statement for
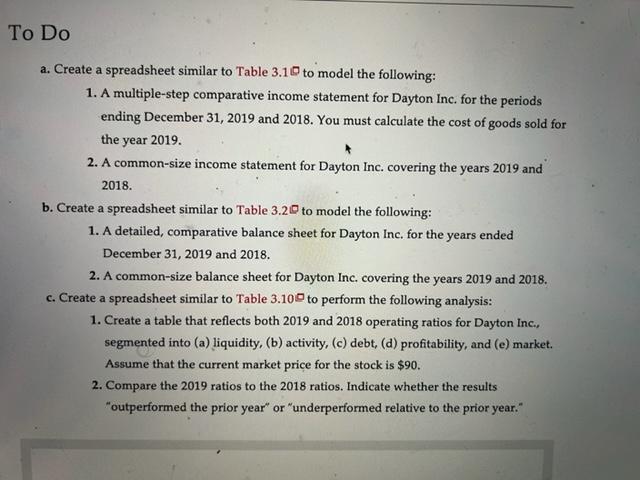
Please answer part B.
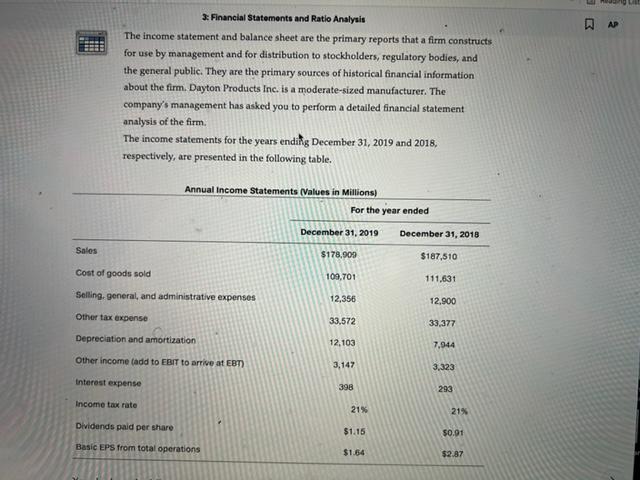
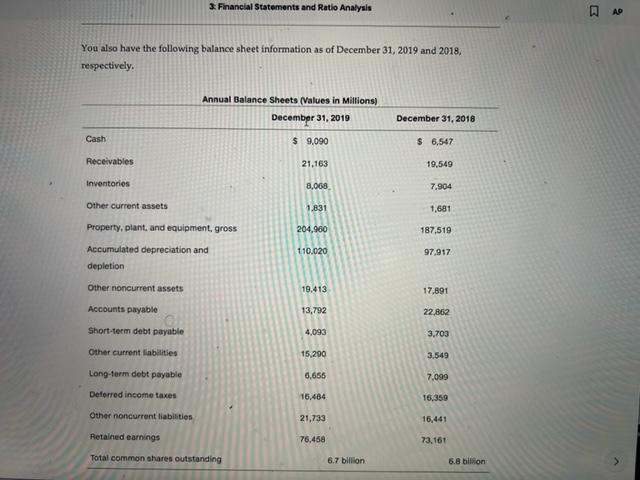
To Do a. Create a spreadsheet similar to Table 3.10 to model the following: 1. A multiple-step comparative income statement for Dayton Inc. for the periods ending December 31, 2019 and 2018. You must calculate the cost of goods sold for the year 2019. 2. A common-size income statement for Dayton Inc. covering the years 2019 and 2018. b. Create a spreadsheet similar to Table 3.20 to model the following: 1. A detailed, comparative balance sheet for Dayton Inc. for the years ended December 31, 2019 and 2018. 2. A common-size balance sheet for Dayton Inc. covering the years 2019 and 2018. c. Create a spreadsheet similar to Table 3.100 to perform the following analysis: 1. Create a table that reflects both 2019 and 2018 operating ratios for Dayton Inc., segmented into (a) liquidity, (b) activity, (c) debt, (d) profitability, and (e) market. Assume that the current market price for the stock is $90. 2. Compare the 2019 ratios to the 2018 ratios. Indicate whether the results "outperformed the prior year" or "underperformed relative to the prior year." 3: Financial Statements and Ratio Analysis The income statement and balance sheet are the primary reports that a firm constructs for use by management and for distribution to stockholders, regulatory bodies, and the general public. They are the primary sources of historical financial information about the firm. Dayton Products Inc. is a moderate-sized manufacturer. The company's management has asked you to perform a detailed financial statement analysis of the firm. The income statements for the years ending December 31, 2019 and 2018, respectively, are presented in the following table. Annual Income Statements Values in Millions) For the year ended December 31, 2019 December 31, 2018 Sales $178,900 $187,510 Cost of goods sold 109,701 111,631 Selling, general, and administrative expenses 12,356 12,900 Other tax expense 33,572 33,377 Depreciation and amortization 12,103 7,044 Other income add to EBIT to arrive at EBT) 3,147 3,323 Interest expense 398 293 Income tax rate 21% 21% Dividends paid per share $1.15 50.91 Basic EPS from total operations $1.64 $2.87 3. Financial Statements and Ratio Analysis You also have the following balance sheet information as of December 31, 2019 and 2018, respectively. Annual Balance Sheets (Values in Millions) December 31, 2019 December 31, 2018 Cash $ 9,090 $ 6,547 Receivables 21.163 19,549 Inventarios 8,068 7,904 Other current assets 1.831 1,681 Property, plant, and equipment, gross 204,980 187,519 110.020 97,917 Accumulated depreciation and depletion Other noncurrent assets 19,413 17.891 Accounts payable 13,792 22,862 Short-term debt payable 4,093 3,703 Other current liabilities 15,200 3.549 Long-term debt payable 6,655 7,099 Deferred income taxes 16.484 16.359 Other noncurrent liabilities 21,733 16,441 Retained earnings 76,458 73,161 Total common shares outstanding 6.7 billion 6.8 bilson To Do a. Create a spreadsheet similar to Table 3.10 to model the following: 1. A multiple-step comparative income statement for Dayton Inc. for the periods ending December 31, 2019 and 2018. You must calculate the cost of goods sold for the year 2019. 2. A common-size income statement for Dayton Inc. covering the years 2019 and 2018. b. Create a spreadsheet similar to Table 3.20 to model the following: 1. A detailed, comparative balance sheet for Dayton Inc. for the years ended December 31, 2019 and 2018. 2. A common-size balance sheet for Dayton Inc. covering the years 2019 and 2018. c. Create a spreadsheet similar to Table 3.100 to perform the following analysis: 1. Create a table that reflects both 2019 and 2018 operating ratios for Dayton Inc., segmented into (a) liquidity, (b) activity, (c) debt, (d) profitability, and (e) market. Assume that the current market price for the stock is $90. 2. Compare the 2019 ratios to the 2018 ratios. Indicate whether the results "outperformed the prior year" or "underperformed relative to the prior year." 3: Financial Statements and Ratio Analysis The income statement and balance sheet are the primary reports that a firm constructs for use by management and for distribution to stockholders, regulatory bodies, and the general public. They are the primary sources of historical financial information about the firm. Dayton Products Inc. is a moderate-sized manufacturer. The company's management has asked you to perform a detailed financial statement analysis of the firm. The income statements for the years ending December 31, 2019 and 2018, respectively, are presented in the following table. Annual Income Statements Values in Millions) For the year ended December 31, 2019 December 31, 2018 Sales $178,900 $187,510 Cost of goods sold 109,701 111,631 Selling, general, and administrative expenses 12,356 12,900 Other tax expense 33,572 33,377 Depreciation and amortization 12,103 7,044 Other income add to EBIT to arrive at EBT) 3,147 3,323 Interest expense 398 293 Income tax rate 21% 21% Dividends paid per share $1.15 50.91 Basic EPS from total operations $1.64 $2.87 3. Financial Statements and Ratio Analysis You also have the following balance sheet information as of December 31, 2019 and 2018, respectively. Annual Balance Sheets (Values in Millions) December 31, 2019 December 31, 2018 Cash $ 9,090 $ 6,547 Receivables 21.163 19,549 Inventarios 8,068 7,904 Other current assets 1.831 1,681 Property, plant, and equipment, gross 204,980 187,519 110.020 97,917 Accumulated depreciation and depletion Other noncurrent assets 19,413 17.891 Accounts payable 13,792 22,862 Short-term debt payable 4,093 3,703 Other current liabilities 15,200 3.549 Long-term debt payable 6,655 7,099 Deferred income taxes 16.484 16.359 Other noncurrent liabilities 21,733 16,441 Retained earnings 76,458 73,161 Total common shares outstanding 6.7 billion 6.8 bilsonStep by Step Solution
There are 3 Steps involved in it
Step: 1

Get Instant Access to Expert-Tailored Solutions
See step-by-step solutions with expert insights and AI powered tools for academic success
Step: 2

Step: 3
Ace Your Homework with AI
Get the answers you need in no time with our AI-driven, step-by-step assistance
Get Started
Finance And Sustainable Development
Authors: Magdalena Ziolo
1st Edition
0367819767, 978-0367819767