

Answered step by step
Verified Expert Solution
Question
1 Approved Answer
Please answer question 10 & 11 Bayside Inc. 2011 Income Statement (S in thousands) Net sales Less: Cost of goods sold Less: Depreciation Earnings before
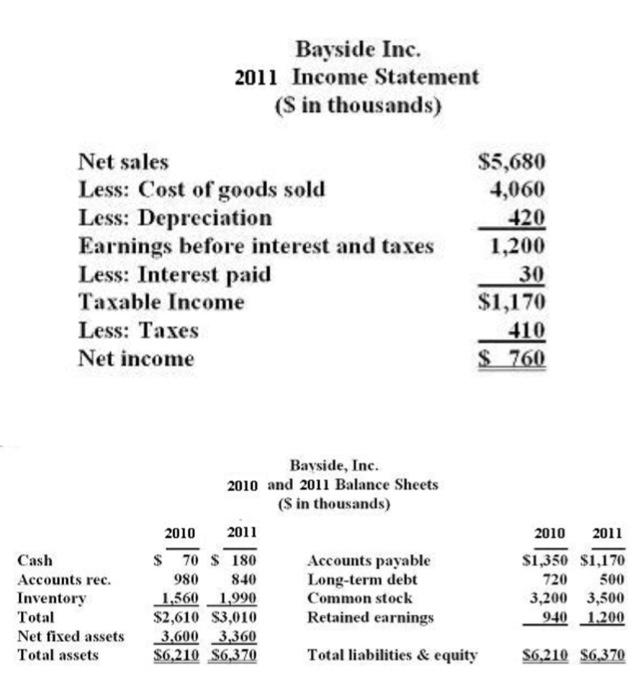
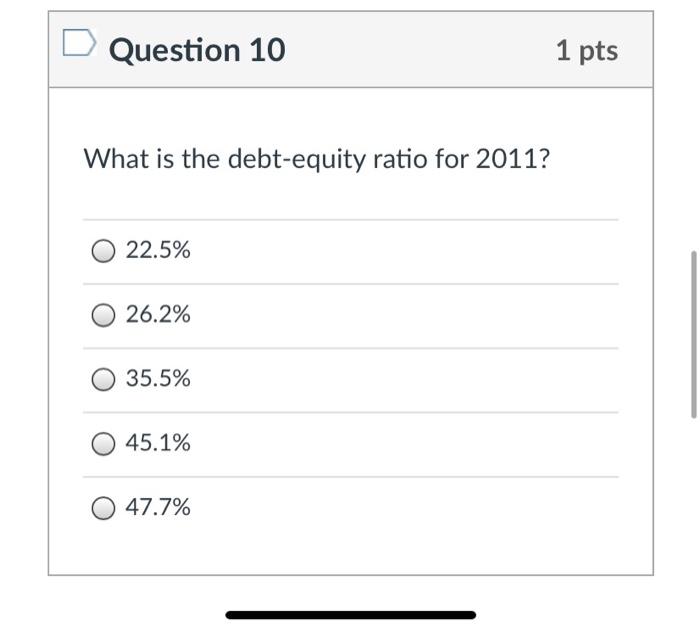
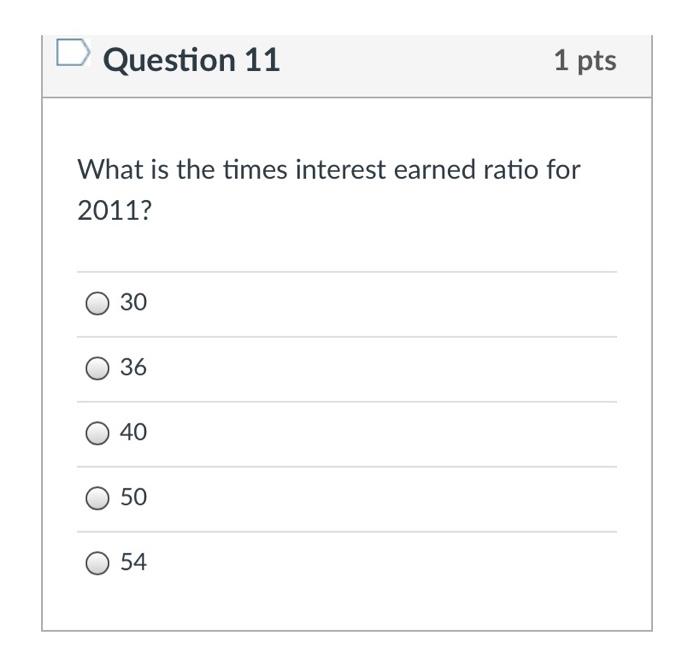
Please answer question 10 & 11
Step by Step Solution
There are 3 Steps involved in it
Step: 1

Get Instant Access to Expert-Tailored Solutions
See step-by-step solutions with expert insights and AI powered tools for academic success
Step: 2

Step: 3
Ace Your Homework with AI
Get the answers you need in no time with our AI-driven, step-by-step assistance
Get Started
Public Finance
Authors: Harvey Rosen, Ted Gayer
10th edition
9781259716874, 78021685, 1259716872, 978-0078021688