

Answered step by step
Verified Expert Solution
Question
1 Approved Answer
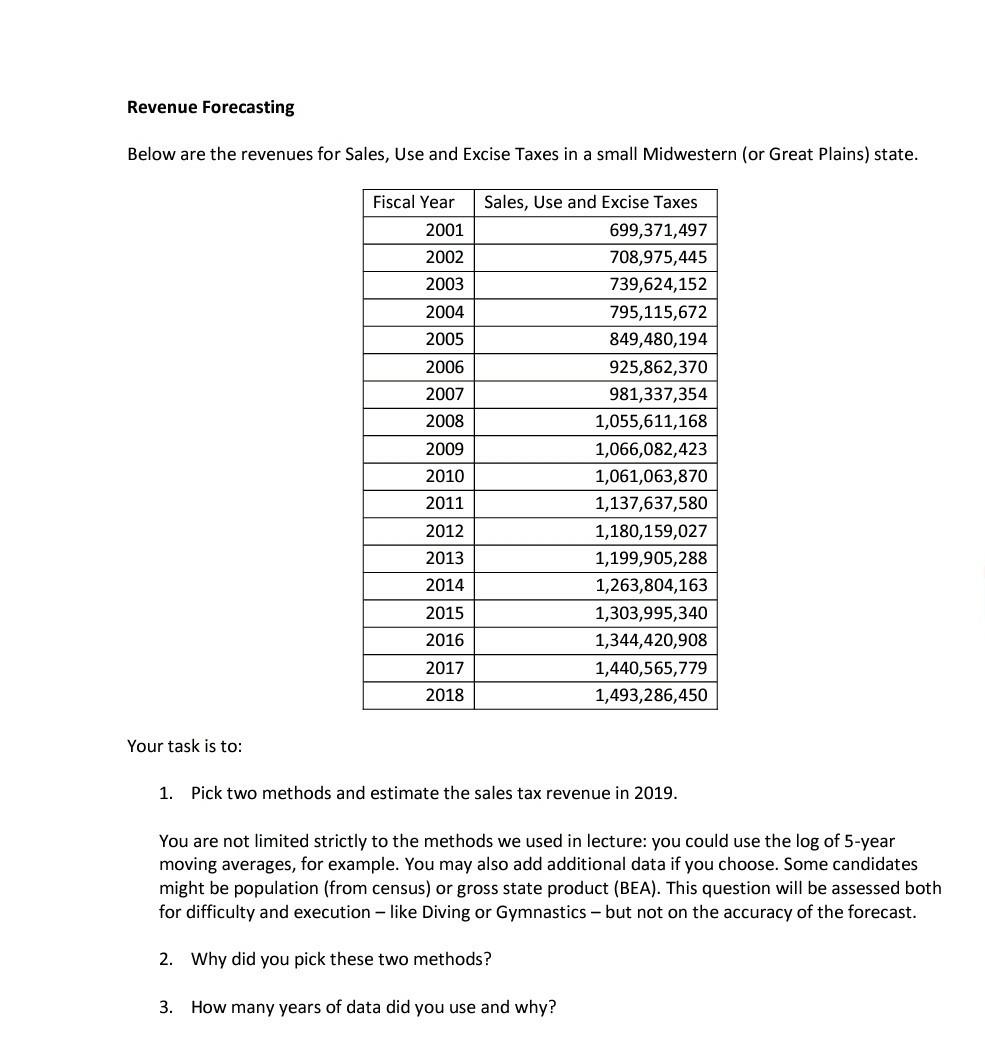
please answer question 1,2,3 Revenue Forecasting Below are the revenues for Sales, Use and Excise Taxes in a small Midwestern (or Great Plains) state. Fiscal
please answer question 1,2,3
Revenue Forecasting Below are the revenues for Sales, Use and Excise Taxes in a small Midwestern (or Great Plains) state. Fiscal Year 2001 2002 2003 2004 2005 2006 2007 2008 2009 2010 2011 Sales, Use and Excise Taxes 699,371,497 708,975,445 739,624,152 795,115,672 849,480,194 925,862,370 981,337,354 1,055,611,168 1,066,082,423 1,061,063,870 1,137,637,580 1,180,159,027 1,199,905,288 1,263,804,163 1,303,995,340 1,344,420,908 1,440,565,779 1,493,286,450 2012 2013 2014 2015 2016 2017 2018 Your task is to: 1. Pick two methods and estimate the sales tax revenue in 2019. You are not limited strictly to the methods we used in lecture: you could use the log of 5-year moving averages, for example. You may also add additional data if you choose. Some candidates might be population (from census) or gross state product (BEA). This question will be assessed both for difficulty and execution - like Diving or Gymnastics - but not on the accuracy of the forecast. 2. Why did you pick these two methods? 3. How many years of data did you use and why? Revenue Forecasting Below are the revenues for Sales, Use and Excise Taxes in a small Midwestern (or Great Plains) state. Fiscal Year 2001 2002 2003 2004 2005 2006 2007 2008 2009 2010 2011 Sales, Use and Excise Taxes 699,371,497 708,975,445 739,624,152 795,115,672 849,480,194 925,862,370 981,337,354 1,055,611,168 1,066,082,423 1,061,063,870 1,137,637,580 1,180,159,027 1,199,905,288 1,263,804,163 1,303,995,340 1,344,420,908 1,440,565,779 1,493,286,450 2012 2013 2014 2015 2016 2017 2018 Your task is to: 1. Pick two methods and estimate the sales tax revenue in 2019. You are not limited strictly to the methods we used in lecture: you could use the log of 5-year moving averages, for example. You may also add additional data if you choose. Some candidates might be population (from census) or gross state product (BEA). This question will be assessed both for difficulty and execution - like Diving or Gymnastics - but not on the accuracy of the forecast. 2. Why did you pick these two methods? 3. How many years of data did you use and whyStep by Step Solution
There are 3 Steps involved in it
Step: 1

Get Instant Access to Expert-Tailored Solutions
See step-by-step solutions with expert insights and AI powered tools for academic success
Step: 2

Step: 3
Ace Your Homework with AI
Get the answers you need in no time with our AI-driven, step-by-step assistance
Get Started
Basic Finance An Introduction to Financial Institutions Investments and Management
Authors: Herbert B. Mayo
10th edition
1111820635, 978-1111820633