Answered step by step
Verified Expert Solution
Link Copied!

Question

1 Approved Answer

Please answer Question e. only. 318 CHAPTER 11 COMMON STOCKS: ANALYSIS AND STRATEGY c. Which portfolio was more risky? d. Calculate the correlation between the
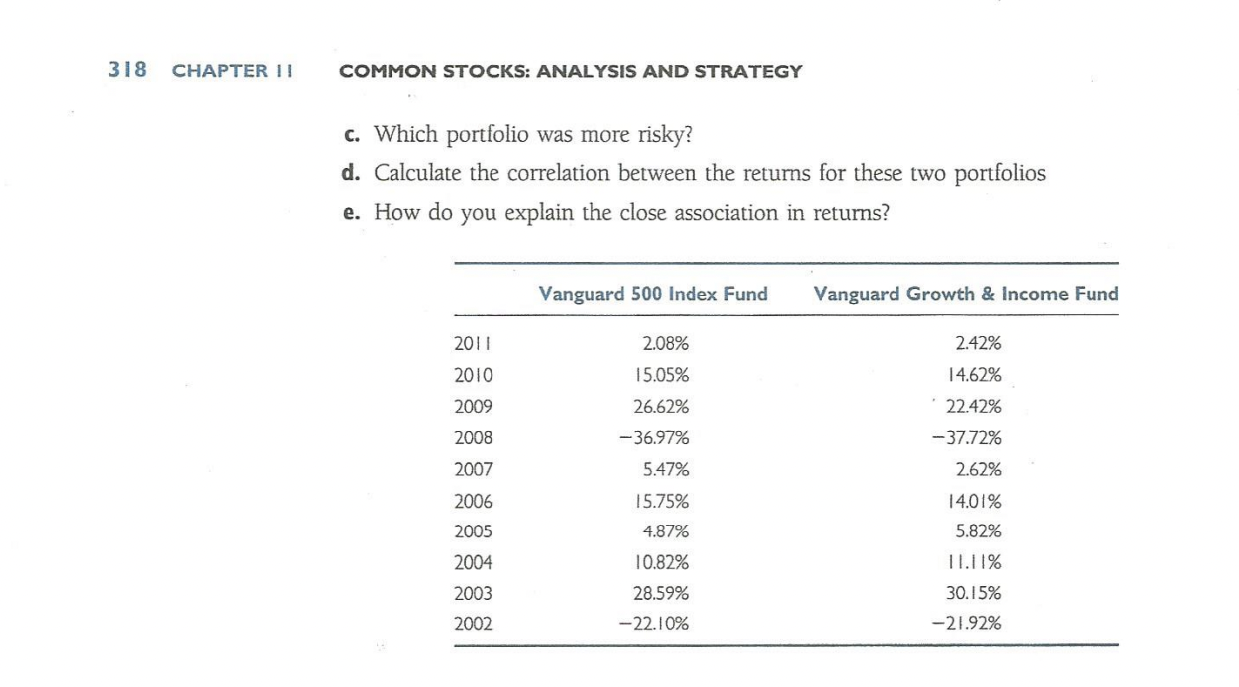
image text in transcribedPlease answer Question e. only.

318 CHAPTER 11 COMMON STOCKS: ANALYSIS AND STRATEGY c. Which portfolio was more risky? d. Calculate the correlation between the returns for these two portfolios e. How do you explain the close association in returns? Vanguard 500 Index Fund Vanguard Growth & Income Fund 2011 2.42% 2010 14.62% 2009 22.42% 2.08% 15.05% 26.62% -36.97% 5.47% 15.75% 2008 -37.72% 2.62% 2007 2006 2005 4.87% 2004 14.01% 5.82% 11.11% 30.15% -21.92% 10.82% 28.59% -22.10% 2003 2002

Step by Step Solution

There are 3 Steps involved in it

Step: 1

blur-text-image

Get Instant Access to Expert-Tailored Solutions

See step-by-step solutions with expert insights and AI powered tools for academic success

Step: 2

blur-text-image_2

Step: 3

blur-text-image_3

Ace Your Homework with AI

Get the answers you need in no time with our AI-driven, step-by-step assistance

Get Started

Recommended Textbook for

Short Term Financial Management

Authors: Ned C Hill

1st Edition

0023548207, 978-0023548208

More Books

Students also viewed these Finance questions

Question

2. What efforts are countries making to reverse the brain drain?

Answered: 1 week ago