

Answered step by step
Verified Expert Solution
Question
1 Approved Answer
PLEASE ANSWER QUESTION IN THE 2ND PICTURE ON THE BOTTOM The following graphs are derived using CAPM method based on price information of ATET and
PLEASE ANSWER QUESTION IN THE 2ND PICTURE ON THE BOTTOM 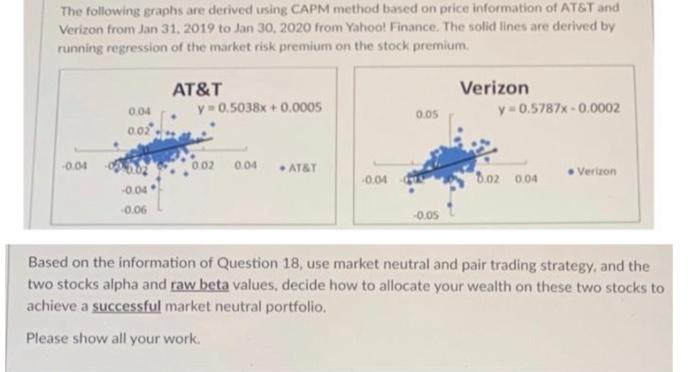
The following graphs are derived using CAPM method based on price information of ATET and Verizon from Jan 31, 2019 to Jan 30, 2020 from Yahool Finance. The solid lines are derived by running regression of the market risk premium on the stock premium. Based on the information of Question 18, use market neutral and pair trading strategy, and the two stocks alpha and raw beta values, decide how to allocate your wealth on these two stocks to achieve a successful market neutral portfolio. Please show all your work Step by Step Solution
There are 3 Steps involved in it
Step: 1

Get Instant Access to Expert-Tailored Solutions
See step-by-step solutions with expert insights and AI powered tools for academic success
Step: 2

Step: 3
Ace Your Homework with AI
Get the answers you need in no time with our AI-driven, step-by-step assistance
Get Started
Blockchain Real World Applications And Understanding How Blockchain Can Be Applied In Your World
Authors: Wayne Walker
1st Edition
1091858586, 978-1091858589