please answer questions 2, 4, and question 5. Thank you 
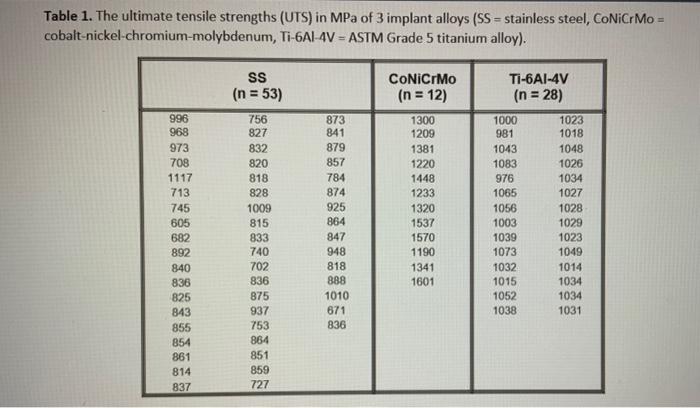
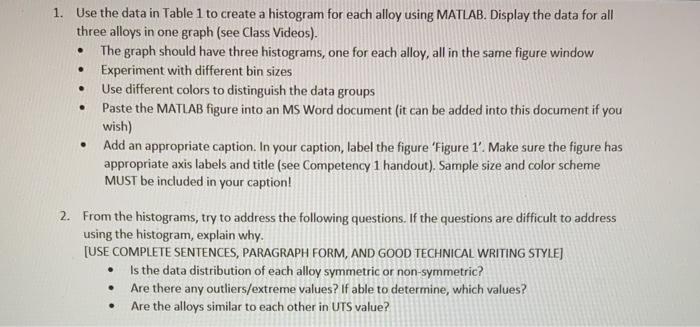
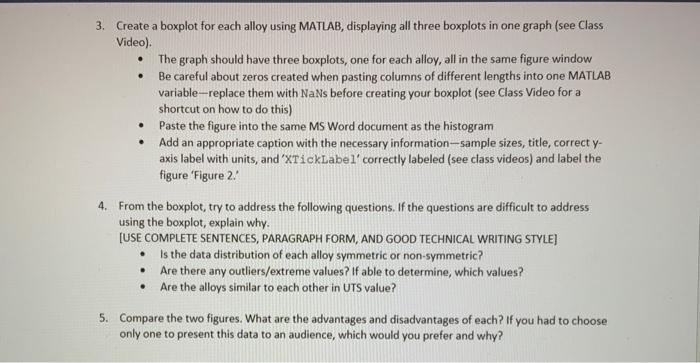
Table 1. The ultimate tensile strengths (UTS) in MPa of 3 implant alloys (SS = stainless steel, CoNiCrMo = cobalt-nickel-chromium-molybdenum, Ti-6Al-4V = ASTM Grade 5 titanium alloy). 1. Use the data in Table 1 to create a histogram for each alloy using MATLAB. Display the data for all three alloys in one graph (see Class Videos). - The graph should have three histograms, one for each alloy, all in the same figure window - Experiment with different bin sizes - Use different colors to distinguish the data groups - Paste the MATLAB figure into an MS Word document (it can be added into this document if you wish) - Add an appropriate caption. In your caption, label the figure 'Figure 1'. Make sure the figure has appropriate axis labels and title (see Competency 1 handout). Sample size and color scheme MUST be included in your caption! 2. From the histograms, try to address the following questions. If the questions are difficult to address using the histogram, explain why. [USE COMPLEIE SENIENCES, PARAGRAPH FORM, AND GOOD TECHNICAL WRITING STYLE] - Is the data distribution of each alloy symmetric or non-symmetric? - Are there any outliers/extreme values? If able to determine, which values? - Are the alloys similar to each other in UTS value? 3. Create a boxplot for each alloy using MATLAB, displaying all three boxplots in one graph (see Class Video). - The graph should have three boxplots, one for each alloy, all in the same figure window - Be careful about zeros created when pasting columns of different lengths into one MATLAB variable -replace them with NaNs before creating your boxplot (see Class Video for a shortcut on how to do this) - Paste the figure into the same MS Word document as the histogram - Add an appropriate caption with the necessary information - sample sizes, title, correct y axis label with units, and 'XTi ckLabel' correctly labeled (see class videos) and label the figure 'Figure 2.' 4. From the boxplot, try to address the following questions. If the questions are difficult to address using the boxplot, explain why. [USE COMPLETE SENTENCES, PARAGRAPH FORM, AND GOOD TECHNICAL WRITING STYLE] - Is the data distribution of each alloy symmetric or non-symmetric? - Are there any outliers/extreme values? If able to determine, which values? - Are the alloys similar to each other in UTS value? 5. Compare the two figures. What are the advantages and disadvantages of each? If you had to choose only one to present this data to an audience, which would you prefer and why


