Please answer questions 4 & 5 only in the last page. For the strategies, please use chase and level strategies and develop table for each and provide comparisons. 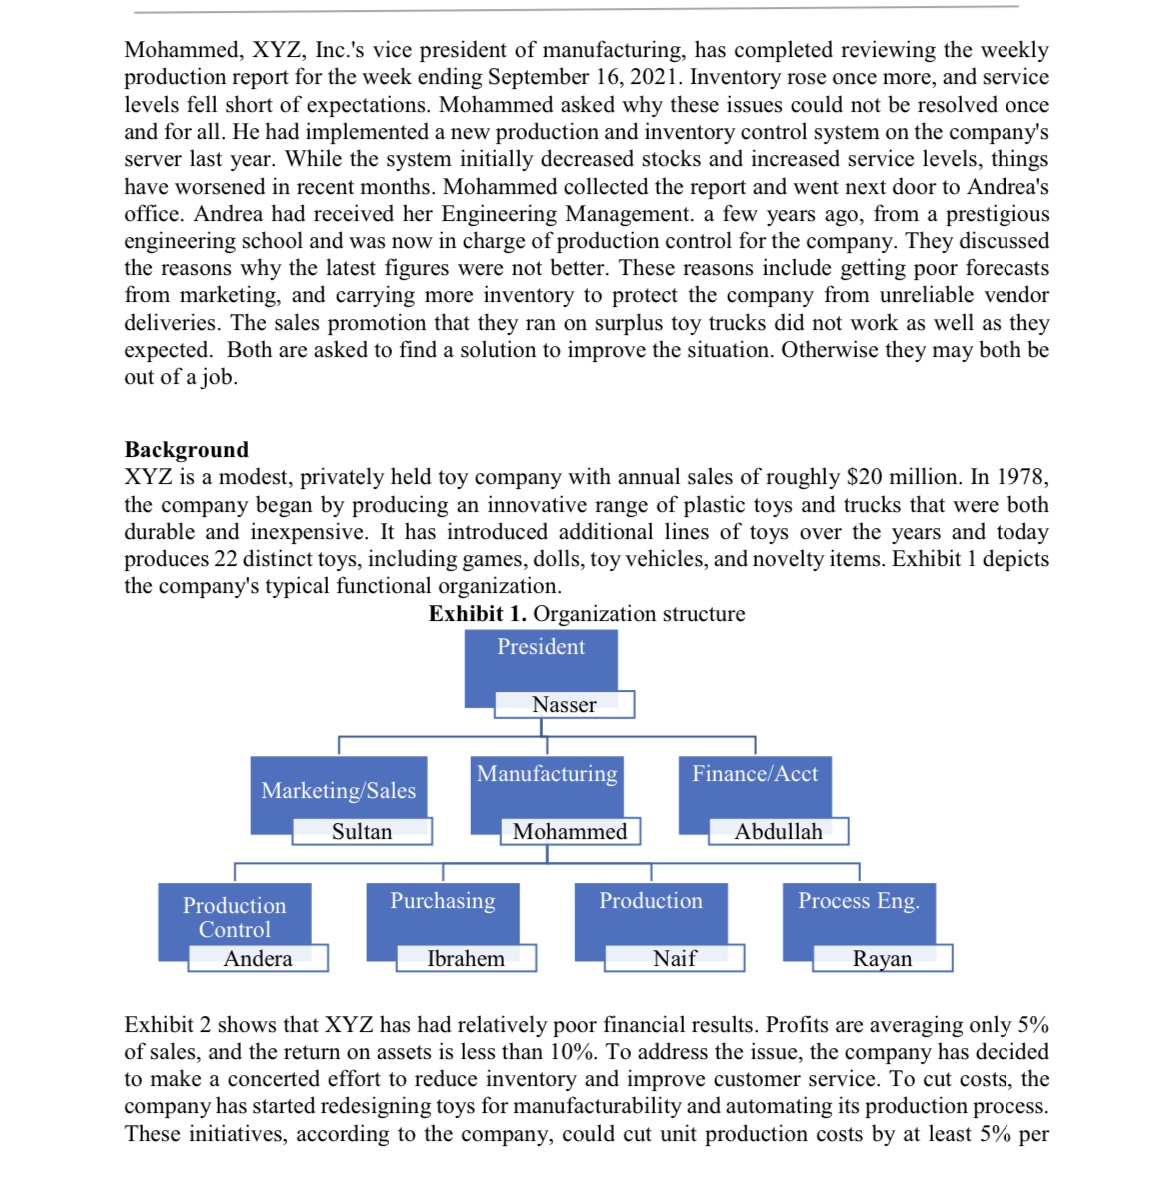
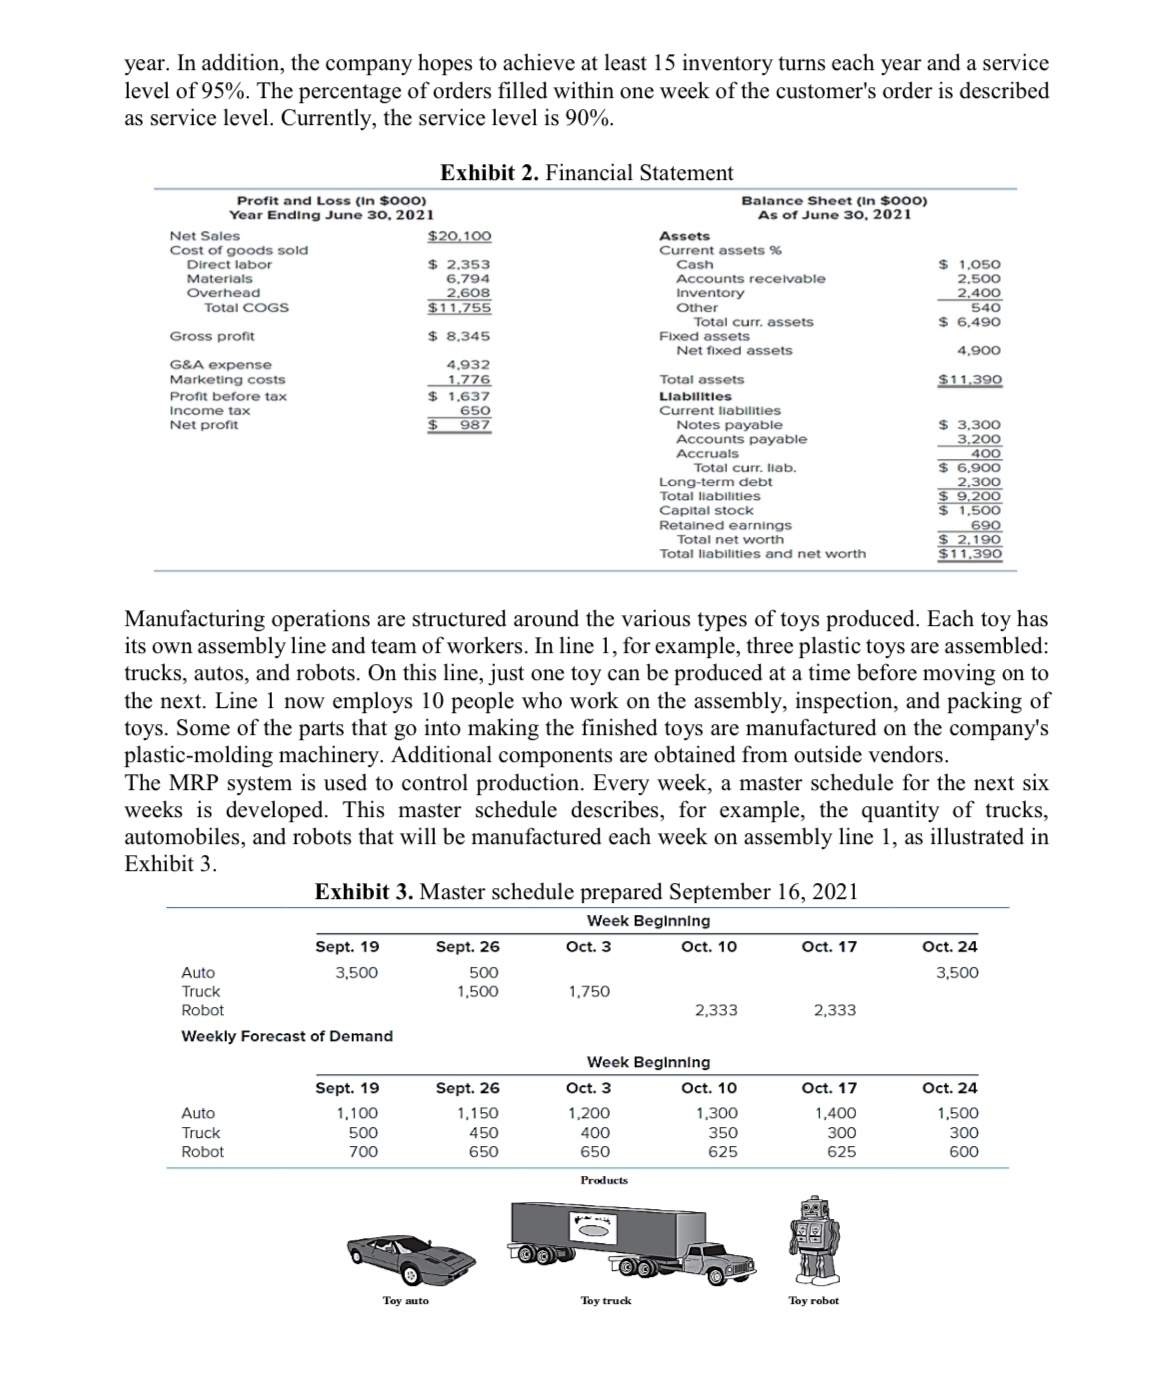
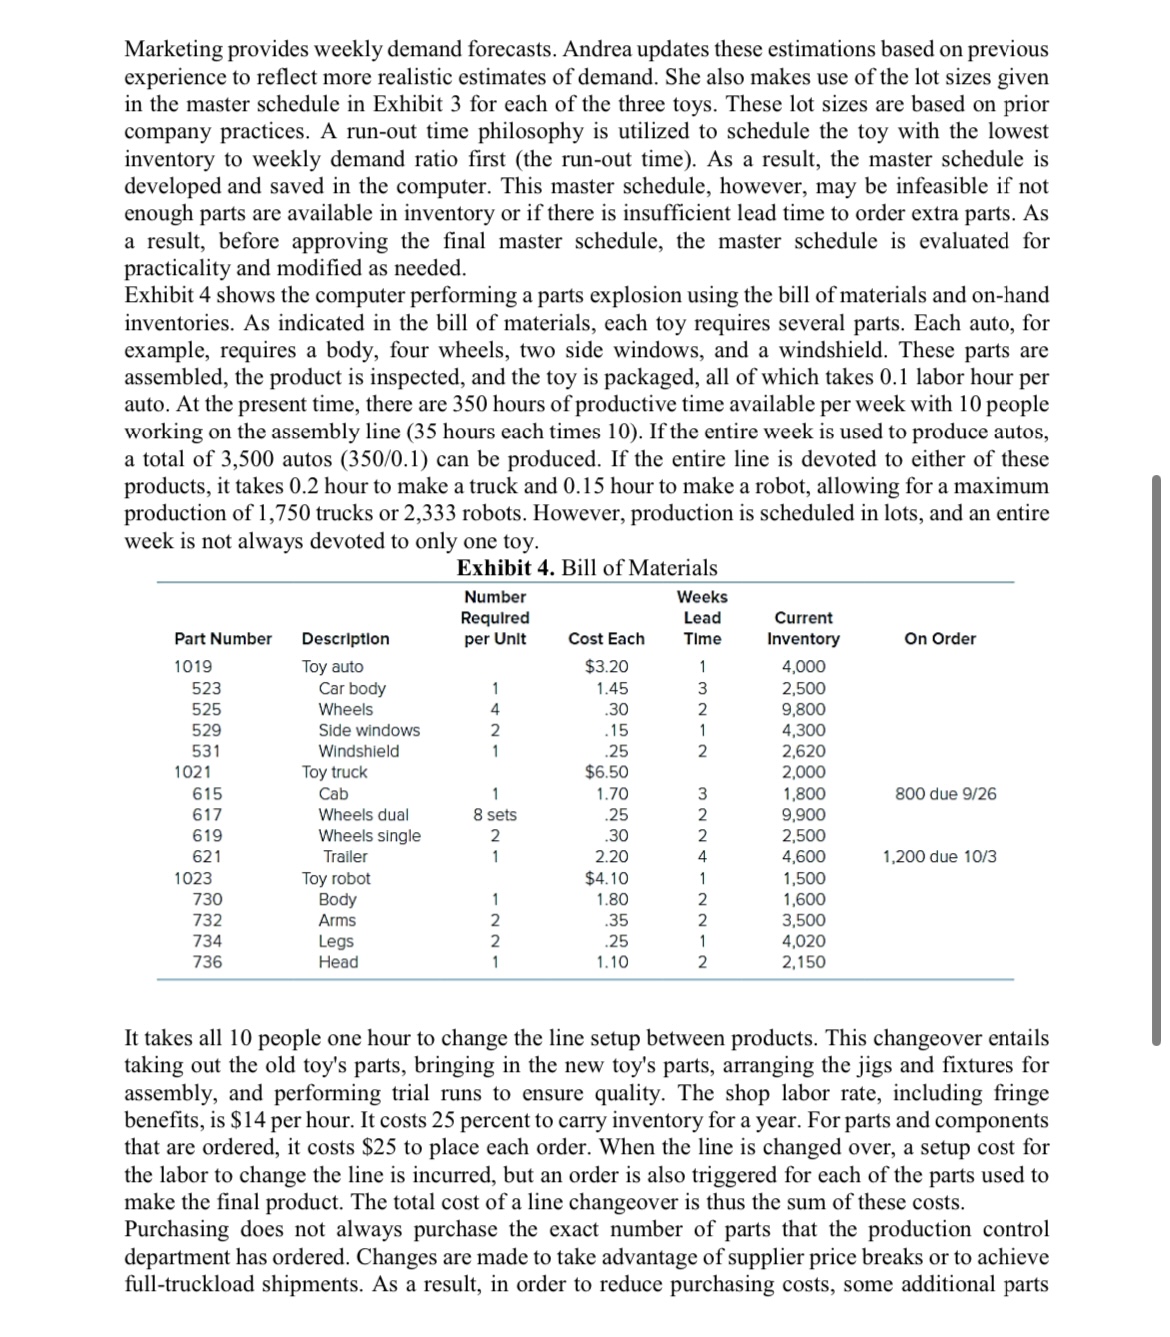
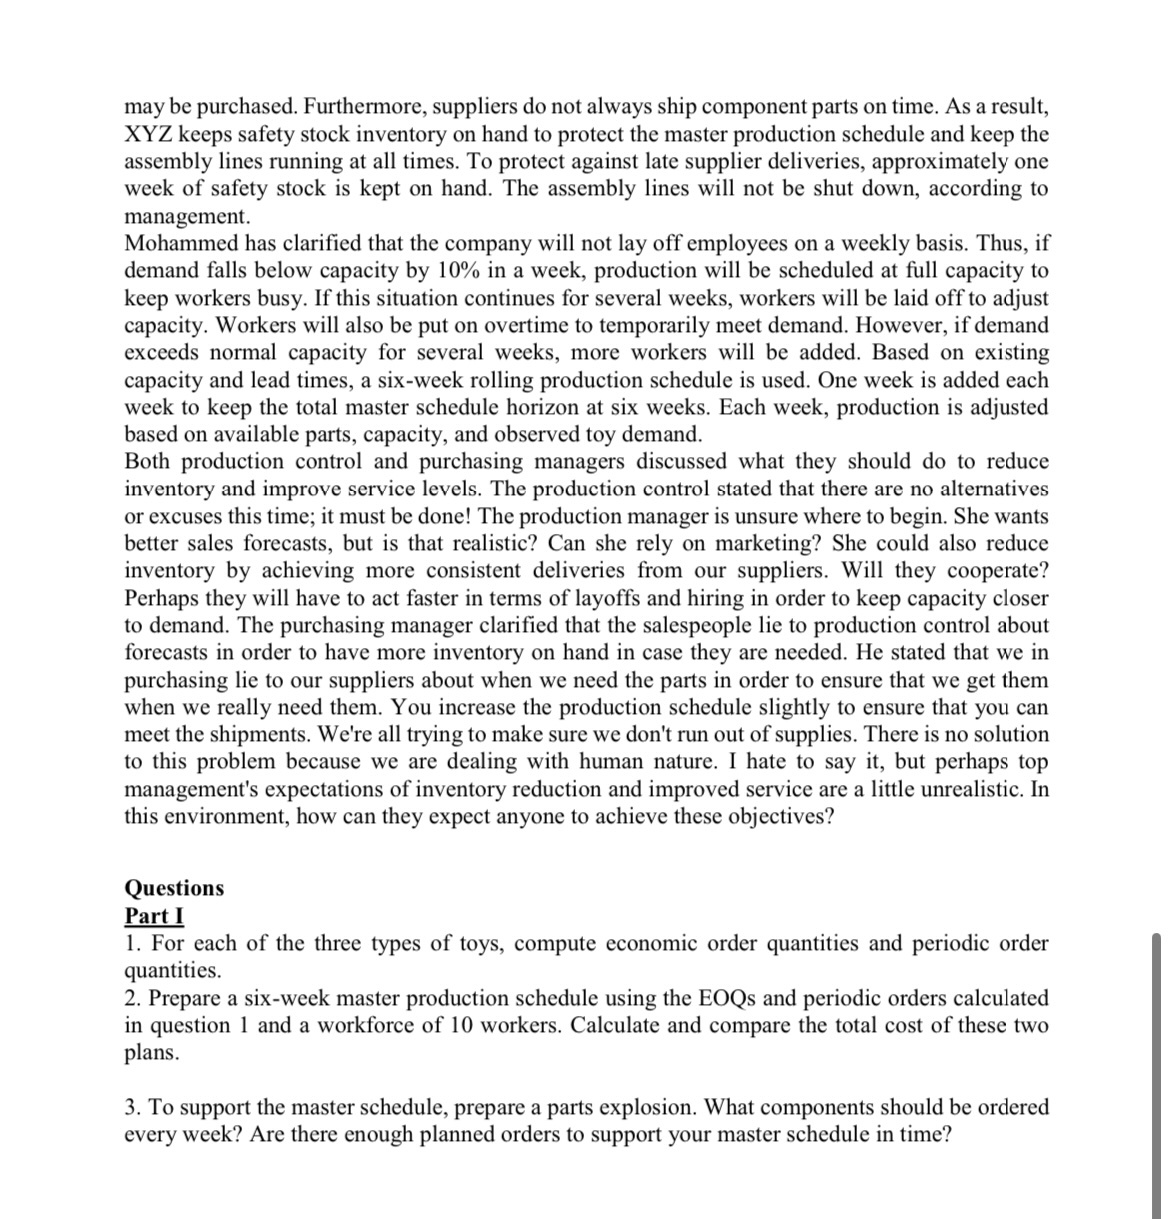
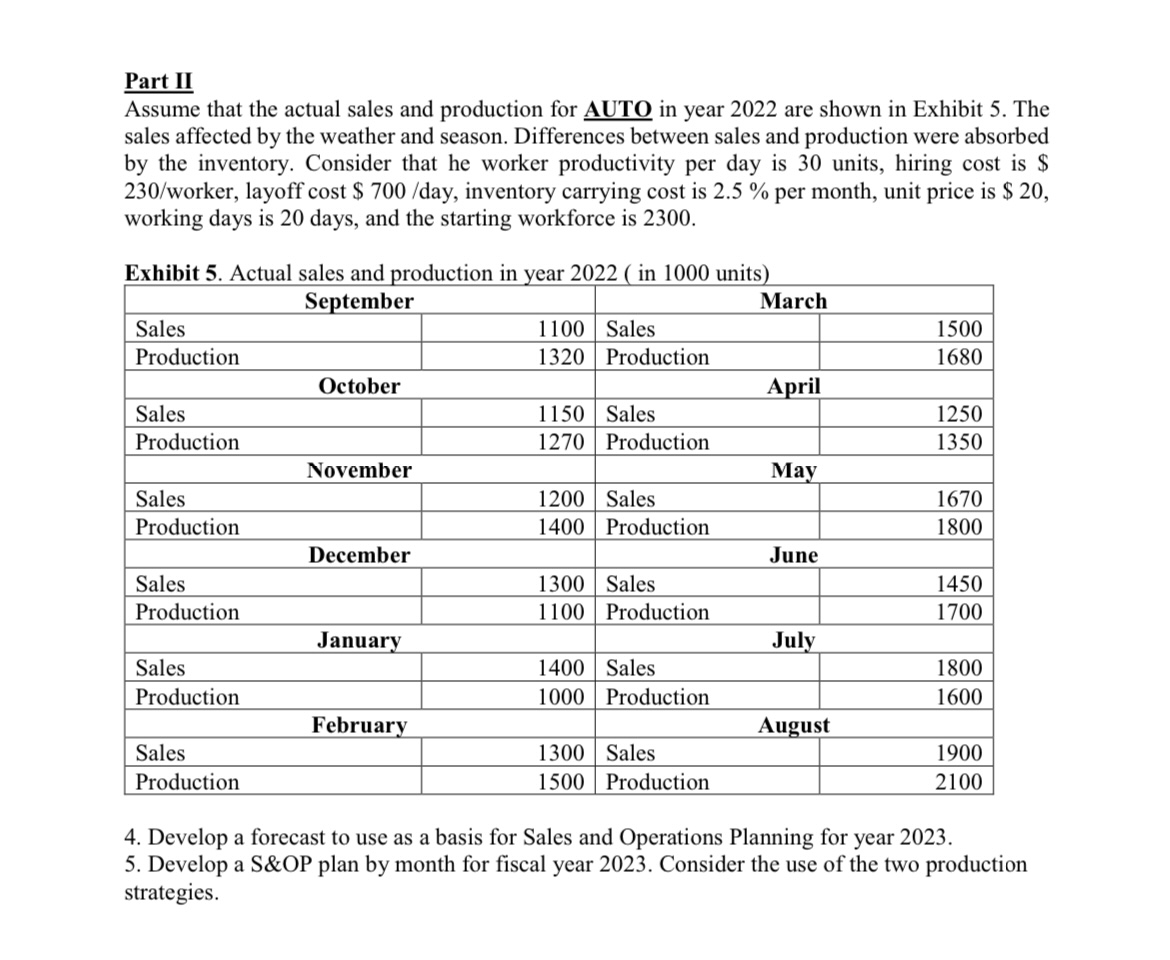
Mohammed, XYZ, Inc.'s vice president of manufacturing, has completed reviewing the weekly production report for the week ending September 16, 2021. Inventory rose once more, and service levels fell short of expectations. Mohammed asked why these issues could not be resolved once and for all. He had implemented a new production and inventory control system on the company's server last year. While the system initially decreased stocks and increased service levels, things have worsened in recent months. Mohammed collected the report and went next door to Andrea's office. Andrea had received her Engineering Management. a few years ago, from a prestigious engineering school and was now in charge of production control for the company. They discussed the reasons why the latest figures were not better. These reasons include getting poor forecasts from marketing, and carrying more inventory to protect the company from unreliable vendor deliveries. The sales promotion that they ran on surplus toy trucks did not work as well as they expected. Both are asked to find a solution to improve the situation. Otherwise they may both be out of a job. Background XYZ is a modest, privately held toy company with annual sales of roughly $20 million. In 1978, the company began by producing an innovative range of plastic toys and trucks that were both durable and inexpensive. It has introduced additional lines of toys over the years and today produces 22 distinct toys, including games, dolls, toy vehicles, and novelty items. Exhibit 1 depicts the company's typical functional organization. Exhibit 1. Organization structure Exhibit 2 shows that XYZ has had relatively poor financial results. Profits are averaging only 5% of sales, and the return on assets is less than 10%. To address the issue, the company has decided to make a concerted effort to reduce inventory and improve customer service. To cut costs, the company has started redesigning toys for manufacturability and automating its production process. These initiatives, according to the company, could cut unit production costs by at least 5% per year. In addition, the company hopes to achieve at least 15 inventory turns each year and a service level of 95%. The percentage of orders filled within one week of the customer's order is described as service level. Currently, the service level is 90%. Manufacturing operations are structured around the various types of toys produced. Each toy has its own assembly line and team of workers. In line 1, for example, three plastic toys are assembled: trucks, autos, and robots. On this line, just one toy can be produced at a time before moving on to the next. Line 1 now employs 10 people who work on the assembly, inspection, and packing of toys. Some of the parts that go into making the finished toys are manufactured on the company's plastic-molding machinery. Additional components are obtained from outside vendors. The MRP system is used to control production. Every week, a master schedule for the next six weeks is developed. This master schedule describes, for example, the quantity of trucks, automobiles, and robots that will be manufactured each week on assembly line 1, as illustrated in Marketing provides weekly demand forecasts. Andrea updates these estimations based on previous experience to reflect more realistic estimates of demand. She also makes use of the lot sizes given in the master schedule in Exhibit 3 for each of the three toys. These lot sizes are based on prior company practices. A run-out time philosophy is utilized to schedule the toy with the lowest inventory to weekly demand ratio first (the run-out time). As a result, the master schedule is developed and saved in the computer. This master schedule, however, may be infeasible if not enough parts are available in inventory or if there is insufficient lead time to order extra parts. As a result, before approving the final master schedule, the master schedule is evaluated for practicality and modified as needed. Exhibit 4 shows the computer performing a parts explosion using the bill of materials and on-hand inventories. As indicated in the bill of materials, each toy requires several parts. Each auto, for example, requires a body, four wheels, two side windows, and a windshield. These parts are assembled, the product is inspected, and the toy is packaged, all of which takes 0.1 labor hour per auto. At the present time, there are 350 hours of productive time available per week with 10 people working on the assembly line ( 35 hours each times 10 ). If the entire week is used to produce autos, a total of 3,500 autos (350/0.1) can be produced. If the entire line is devoted to either of these products, it takes 0.2 hour to make a truck and 0.15 hour to make a robot, allowing for a maximum production of 1,750 trucks or 2,333 robots. However, production is scheduled in lots, and an entire week is not always devoted to only one toy. It takes all 10 people one hour to change the line setup between products. This changeover entails taking out the old toy's parts, bringing in the new toy's parts, arranging the jigs and fixtures for assembly, and performing trial runs to ensure quality. The shop labor rate, including fringe benefits, is $14 per hour. It costs 25 percent to carry inventory for a year. For parts and components that are ordered, it costs $25 to place each order. When the line is changed over, a setup cost for the labor to change the line is incurred, but an order is also triggered for each of the parts used to make the final product. The total cost of a line changeover is thus the sum of these costs. Purchasing does not always purchase the exact number of parts that the production control department has ordered. Changes are made to take advantage of supplier price breaks or to achieve full-truckload shipments. As a result, in order to reduce purchasing costs, some additional parts may be purchased. Furthermore, suppliers do not always ship component parts on time. As a result, XYZ keeps safety stock inventory on hand to protect the master production schedule and keep the assembly lines running at all times. To protect against late supplier deliveries, approximately one week of safety stock is kept on hand. The assembly lines will not be shut down, according to management. Mohammed has clarified that the company will not lay off employees on a weekly basis. Thus, if demand falls below capacity by 10% in a week, production will be scheduled at full capacity to keep workers busy. If this situation continues for several weeks, workers will be laid off to adjust capacity. Workers will also be put on overtime to temporarily meet demand. However, if demand exceeds normal capacity for several weeks, more workers will be added. Based on existing capacity and lead times, a six-week rolling production schedule is used. One week is added each week to keep the total master schedule horizon at six weeks. Each week, production is adjusted based on available parts, capacity, and observed toy demand. Both production control and purchasing managers discussed what they should do to reduce inventory and improve service levels. The production control stated that there are no alternatives or excuses this time; it must be done! The production manager is unsure where to begin. She wants better sales forecasts, but is that realistic? Can she rely on marketing? She could also reduce inventory by achieving more consistent deliveries from our suppliers. Will they cooperate? Perhaps they will have to act faster in terms of layoffs and hiring in order to keep capacity closer to demand. The purchasing manager clarified that the salespeople lie to production control about forecasts in order to have more inventory on hand in case they are needed. He stated that we in purchasing lie to our suppliers about when we need the parts in order to ensure that we get them when we really need them. You increase the production schedule slightly to ensure that you can meet the shipments. We're all trying to make sure we don't run out of supplies. There is no solution to this problem because we are dealing with human nature. I hate to say it, but perhaps top management's expectations of inventory reduction and improved service are a little unrealistic. In this environment, how can they expect anyone to achieve these objectives? Questions Part I 1. For each of the three types of toys, compute economic order quantities and periodic order quantities. 2. Prepare a six-week master production schedule using the EOQs and periodic orders calculated in question 1 and a workforce of 10 workers. Calculate and compare the total cost of these two plans. 3. To support the master schedule, prepare a parts explosion. What components should be ordered every week? Are there enough planned orders to support your master schedule in time? Part II Assume that the actual sales and production for AUTO in year 2022 are shown in Exhibit 5 . The sales affected by the weather and season. Differences between sales and production were absorbed by the inventory. Consider that he worker productivity per day is 30 units, hiring cost is $ 230 /worker, layoff cost $700 /day, inventory carrying cost is 2.5% per month, unit price is $20, working days is 20 days, and the starting workforce is 2300 . 4. Develop a forecast to use as a basis for Sales and Operations Planning for year 2023. 5. Develop a S\&OP plan by month for fiscal year 2023. Consider the use of the two production strategies


