

Question
Please answer questions from 1 to 8 as well as show your work please so I could understand. Assume normal distribution for this data and
Please answer questions from 1 to 8 as well as show your work please so I could understand.
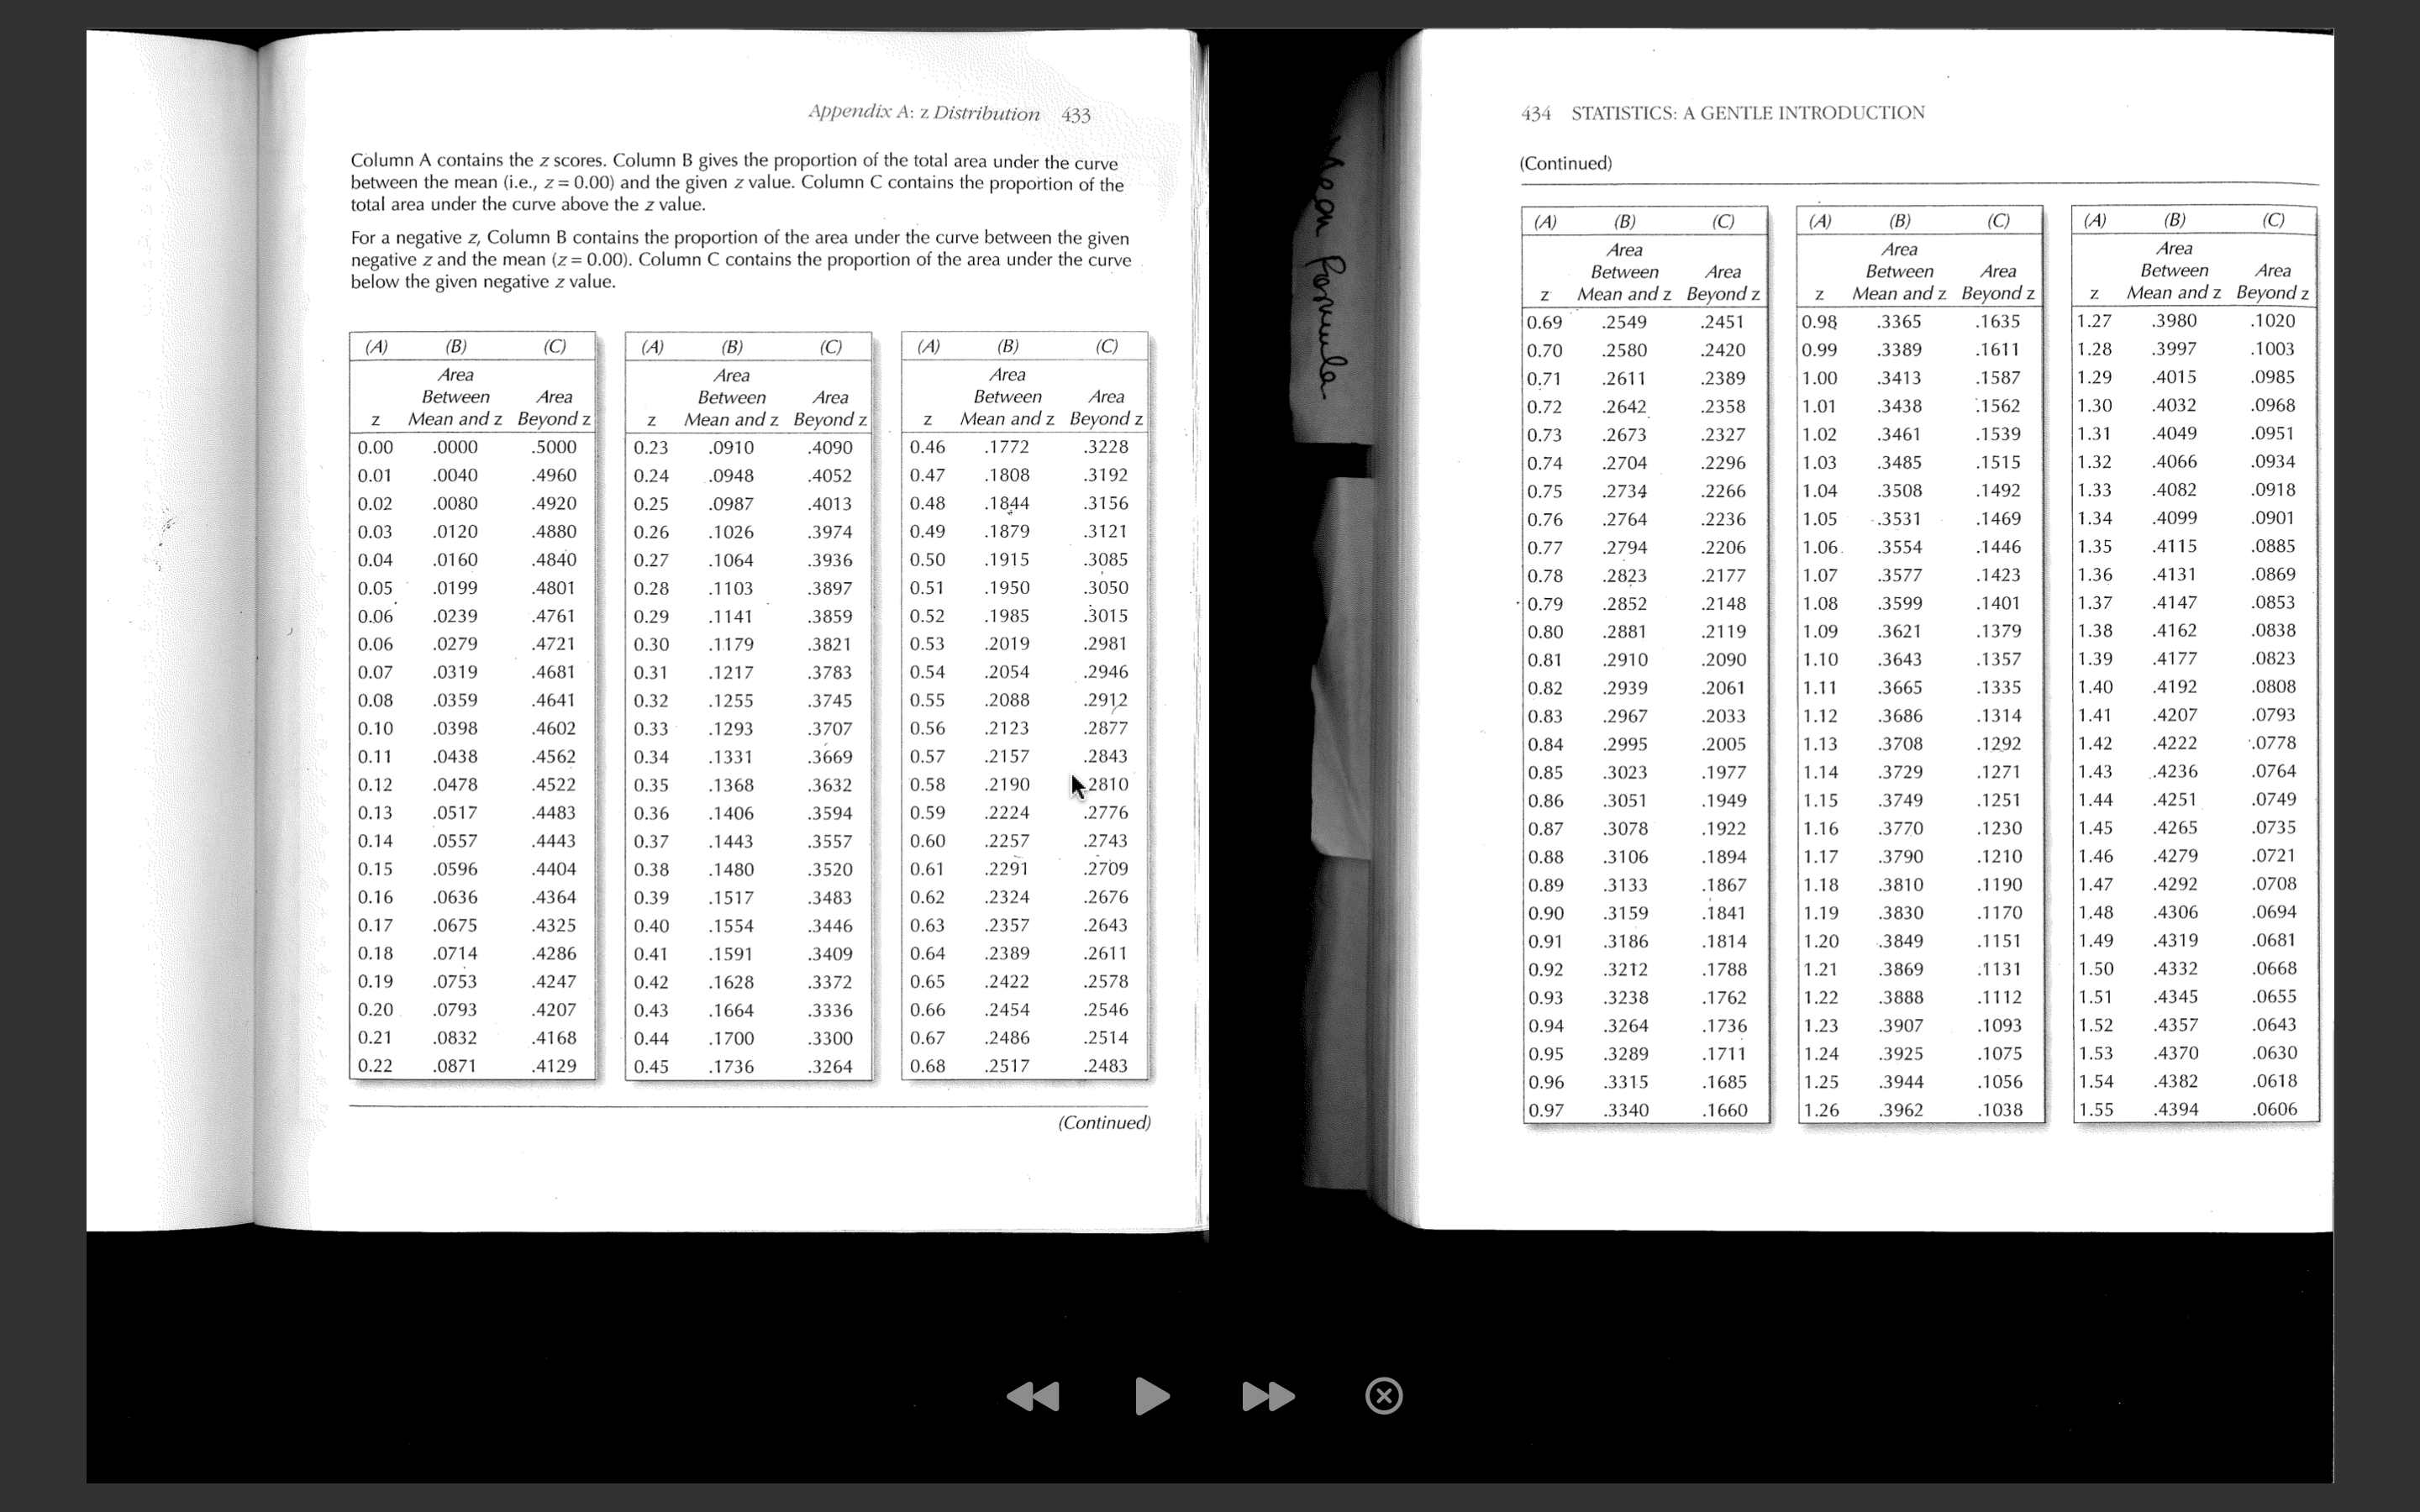
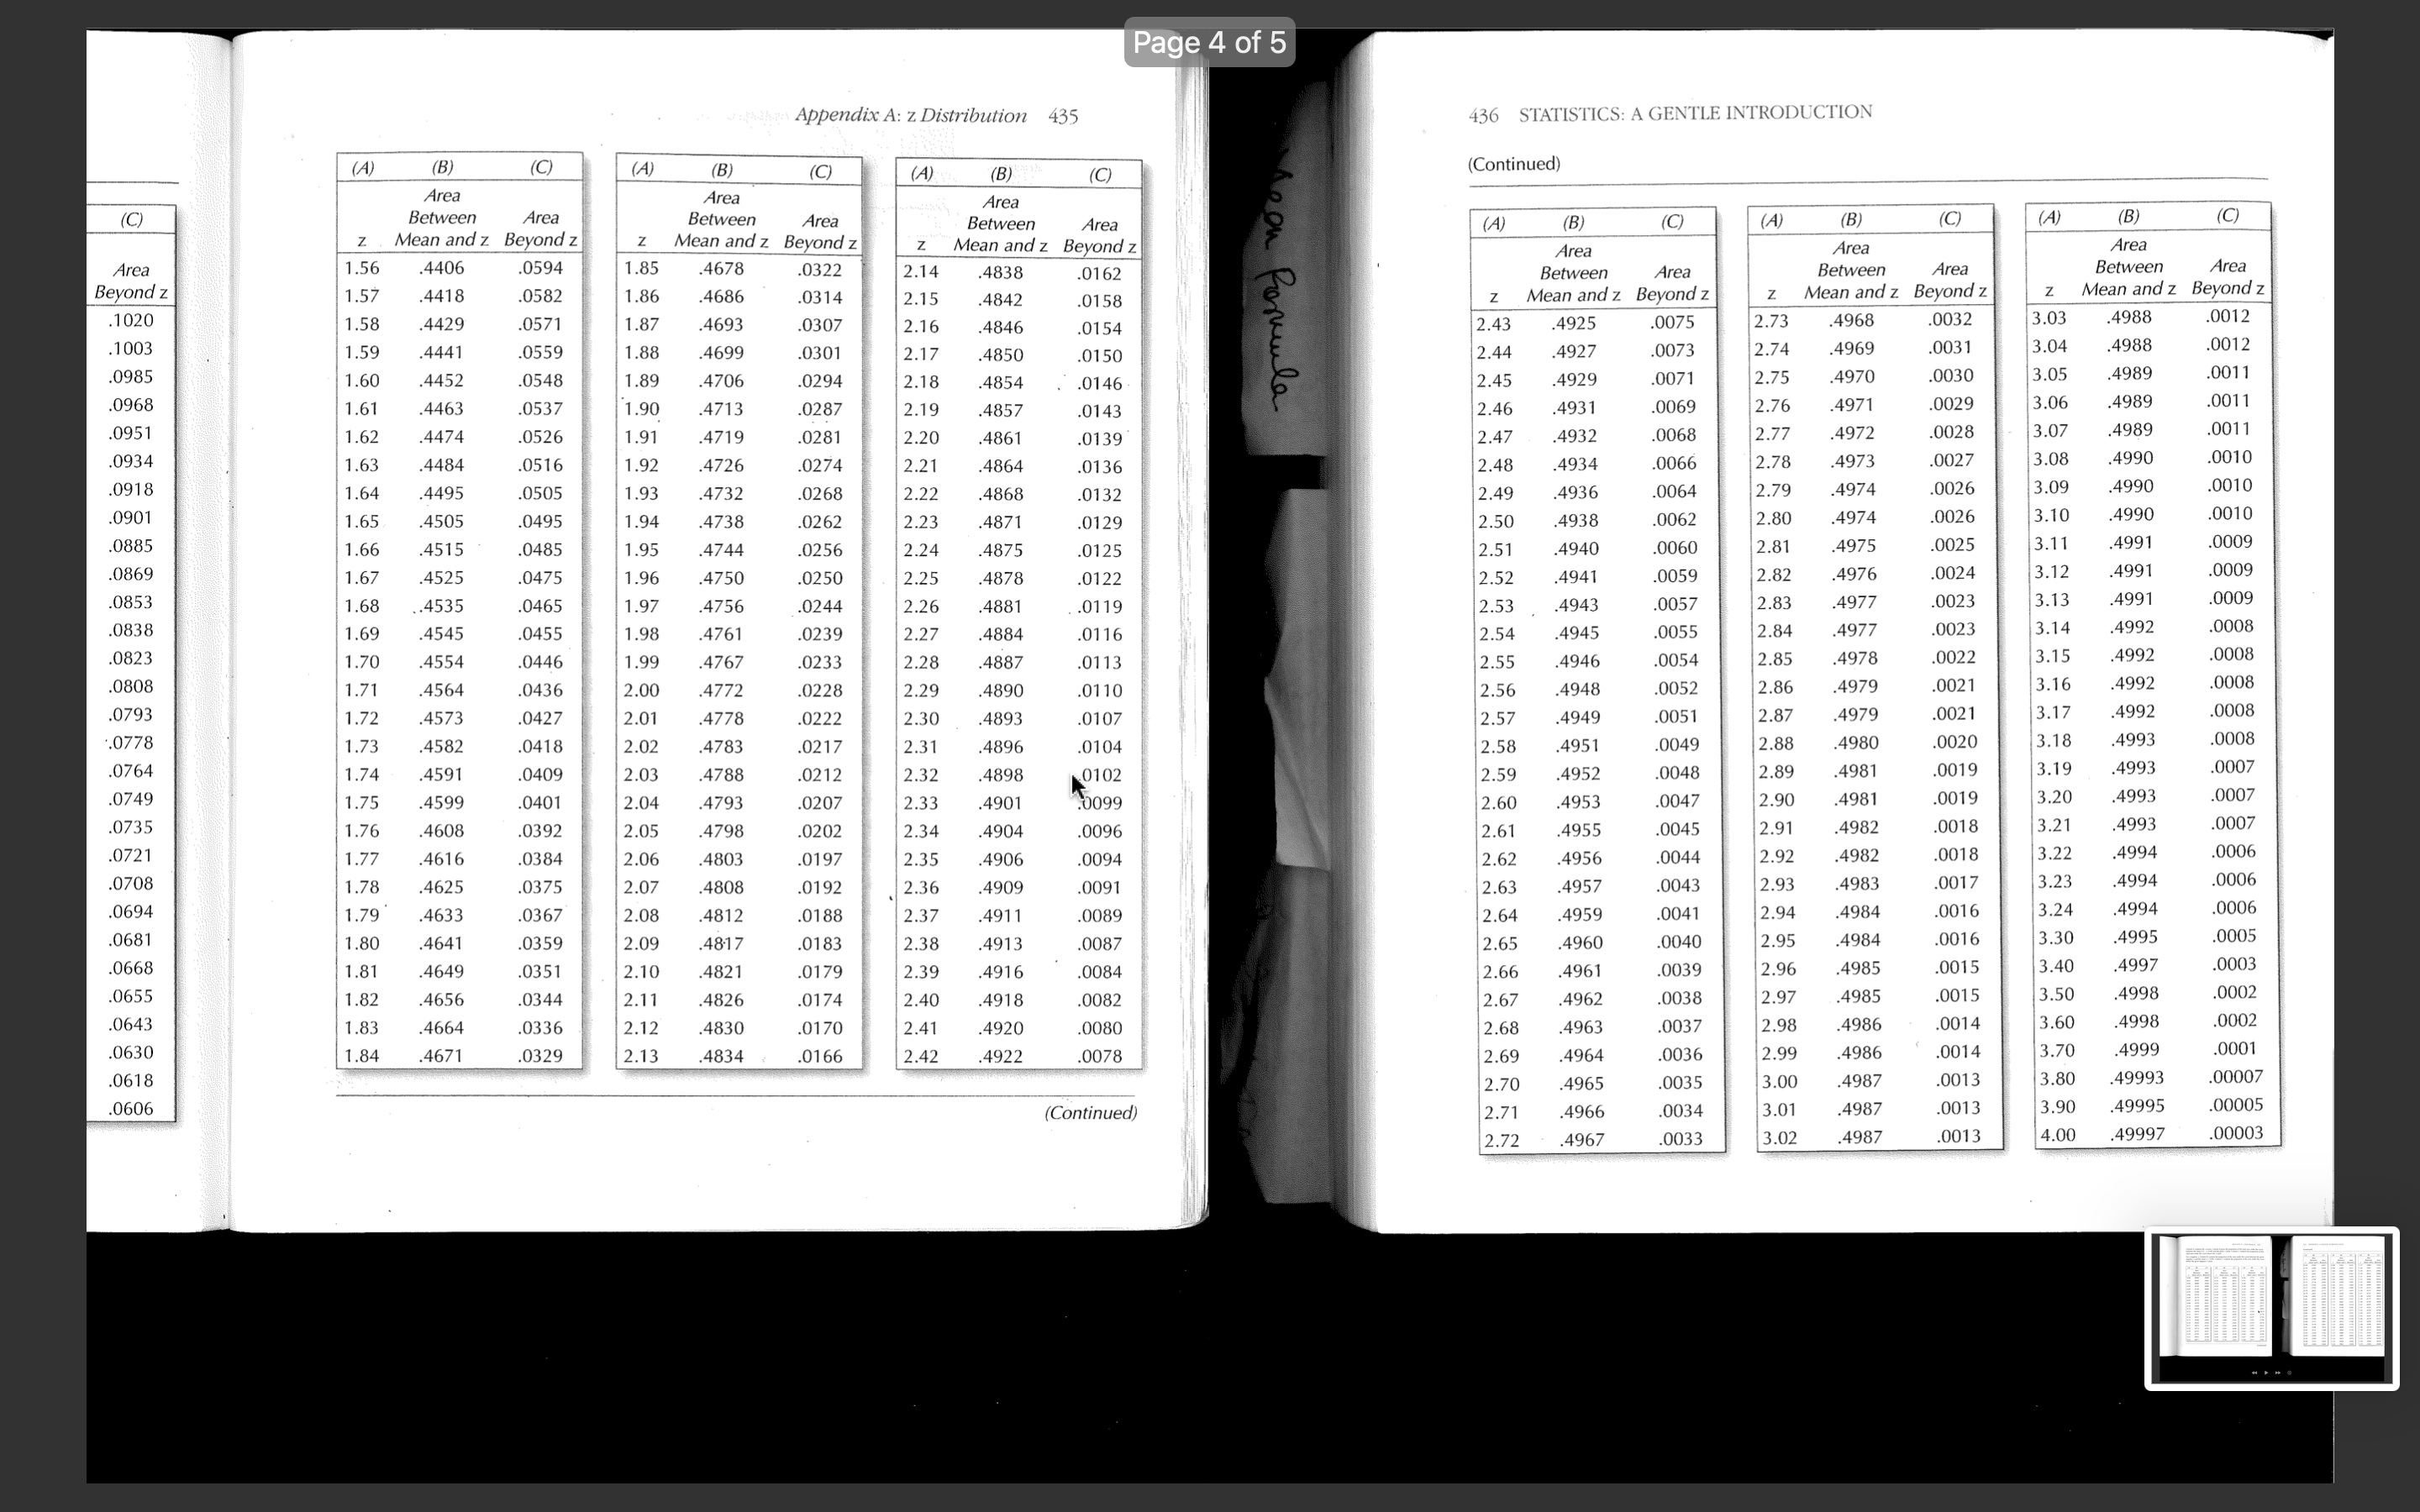
Assume normal distribution for this data and answer the following questions. Please show your work (e.g., 60-68/5.98=-.XXB column=.XX.XX+.XX=.XX -> XX% or XXth percentile). If you worked on paper, you can take photos and submit them.
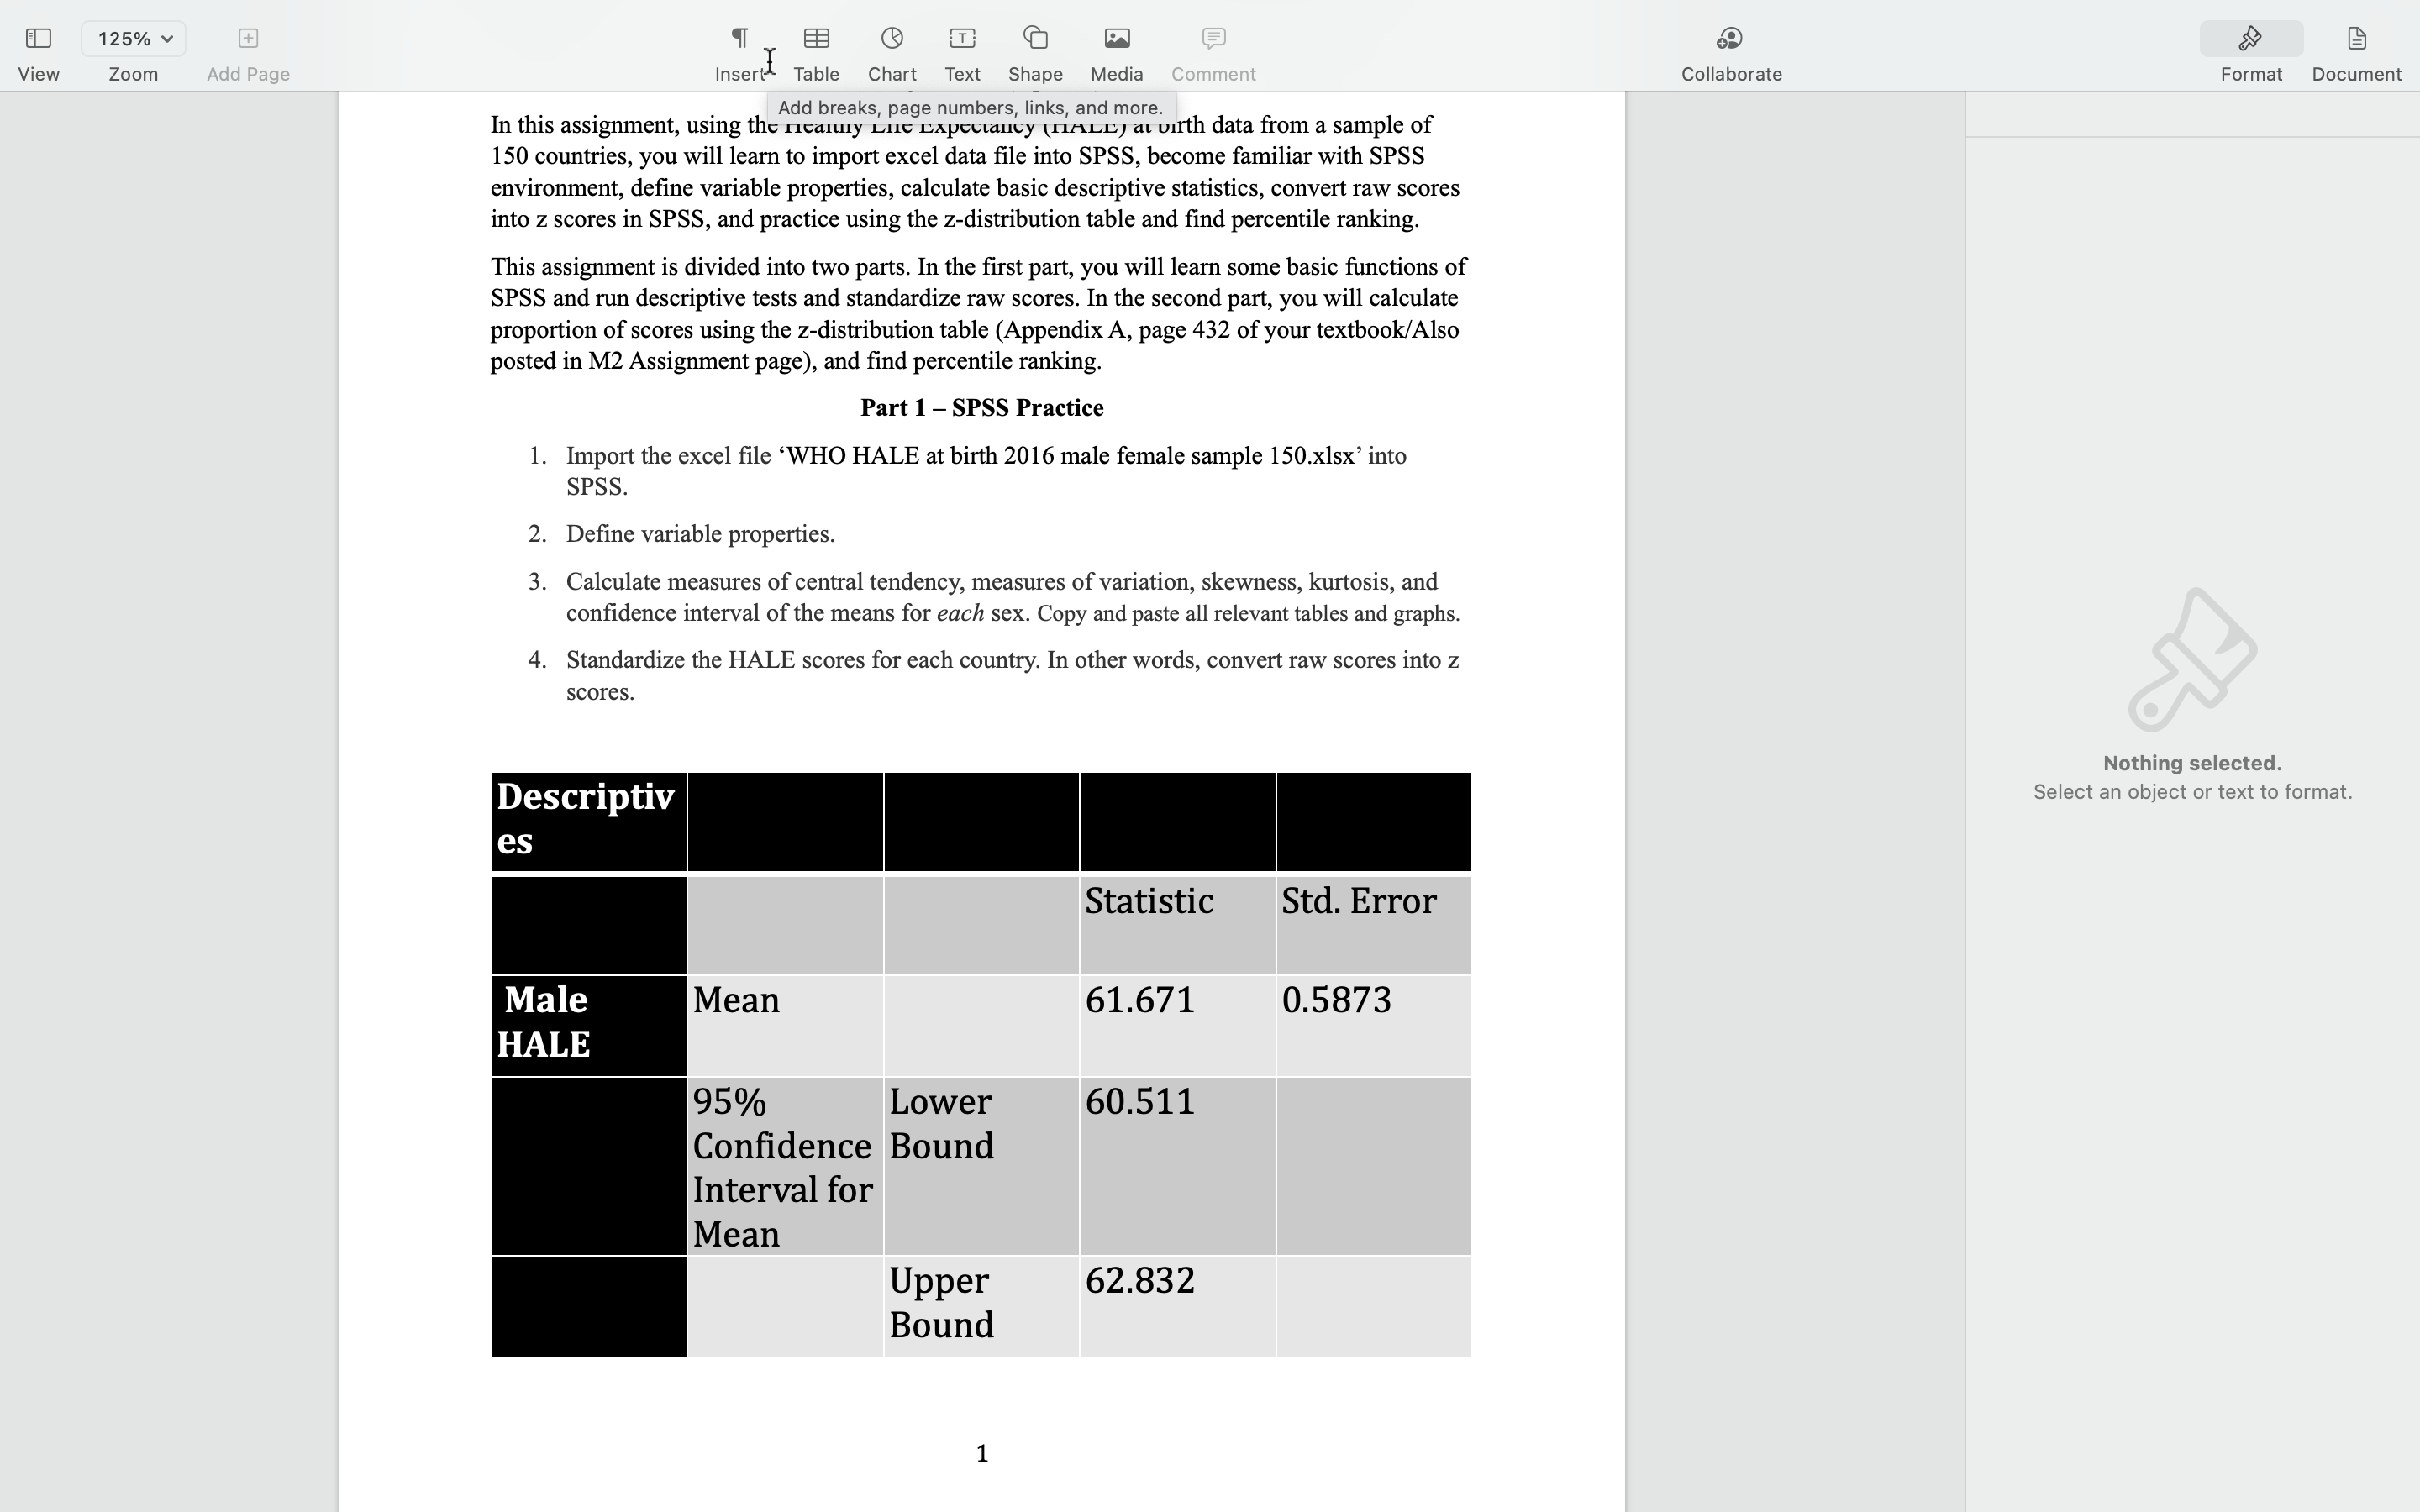
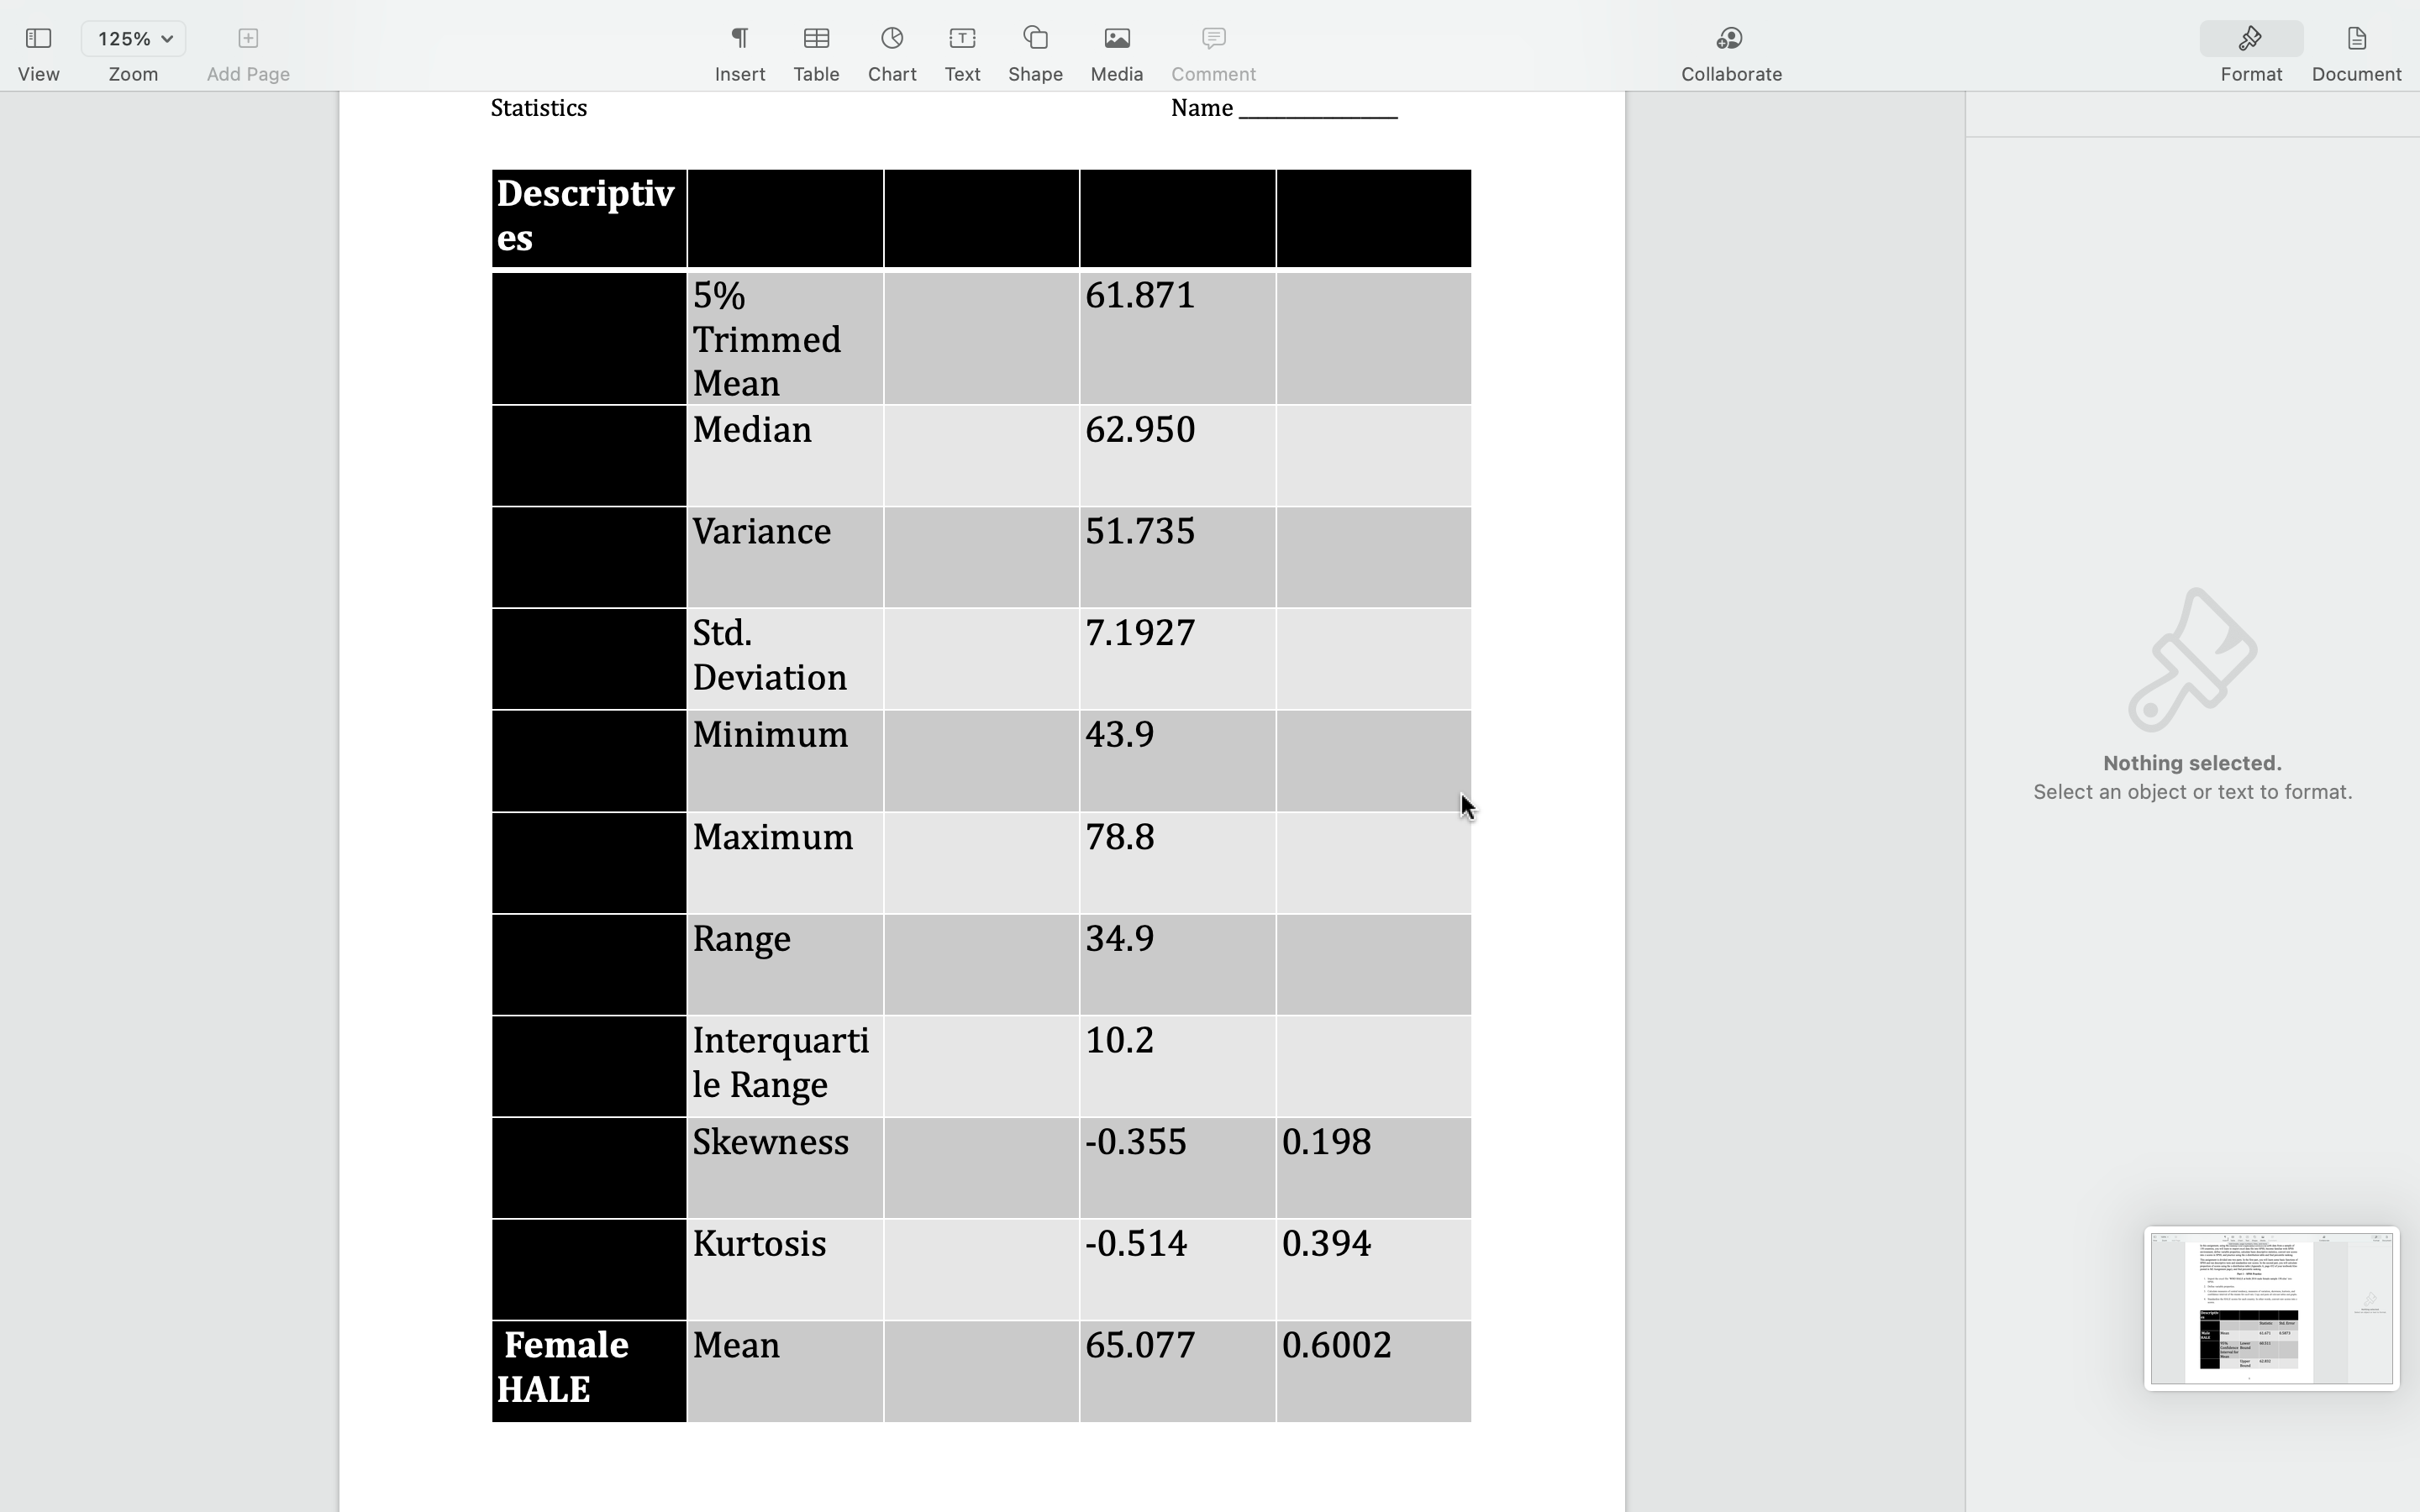
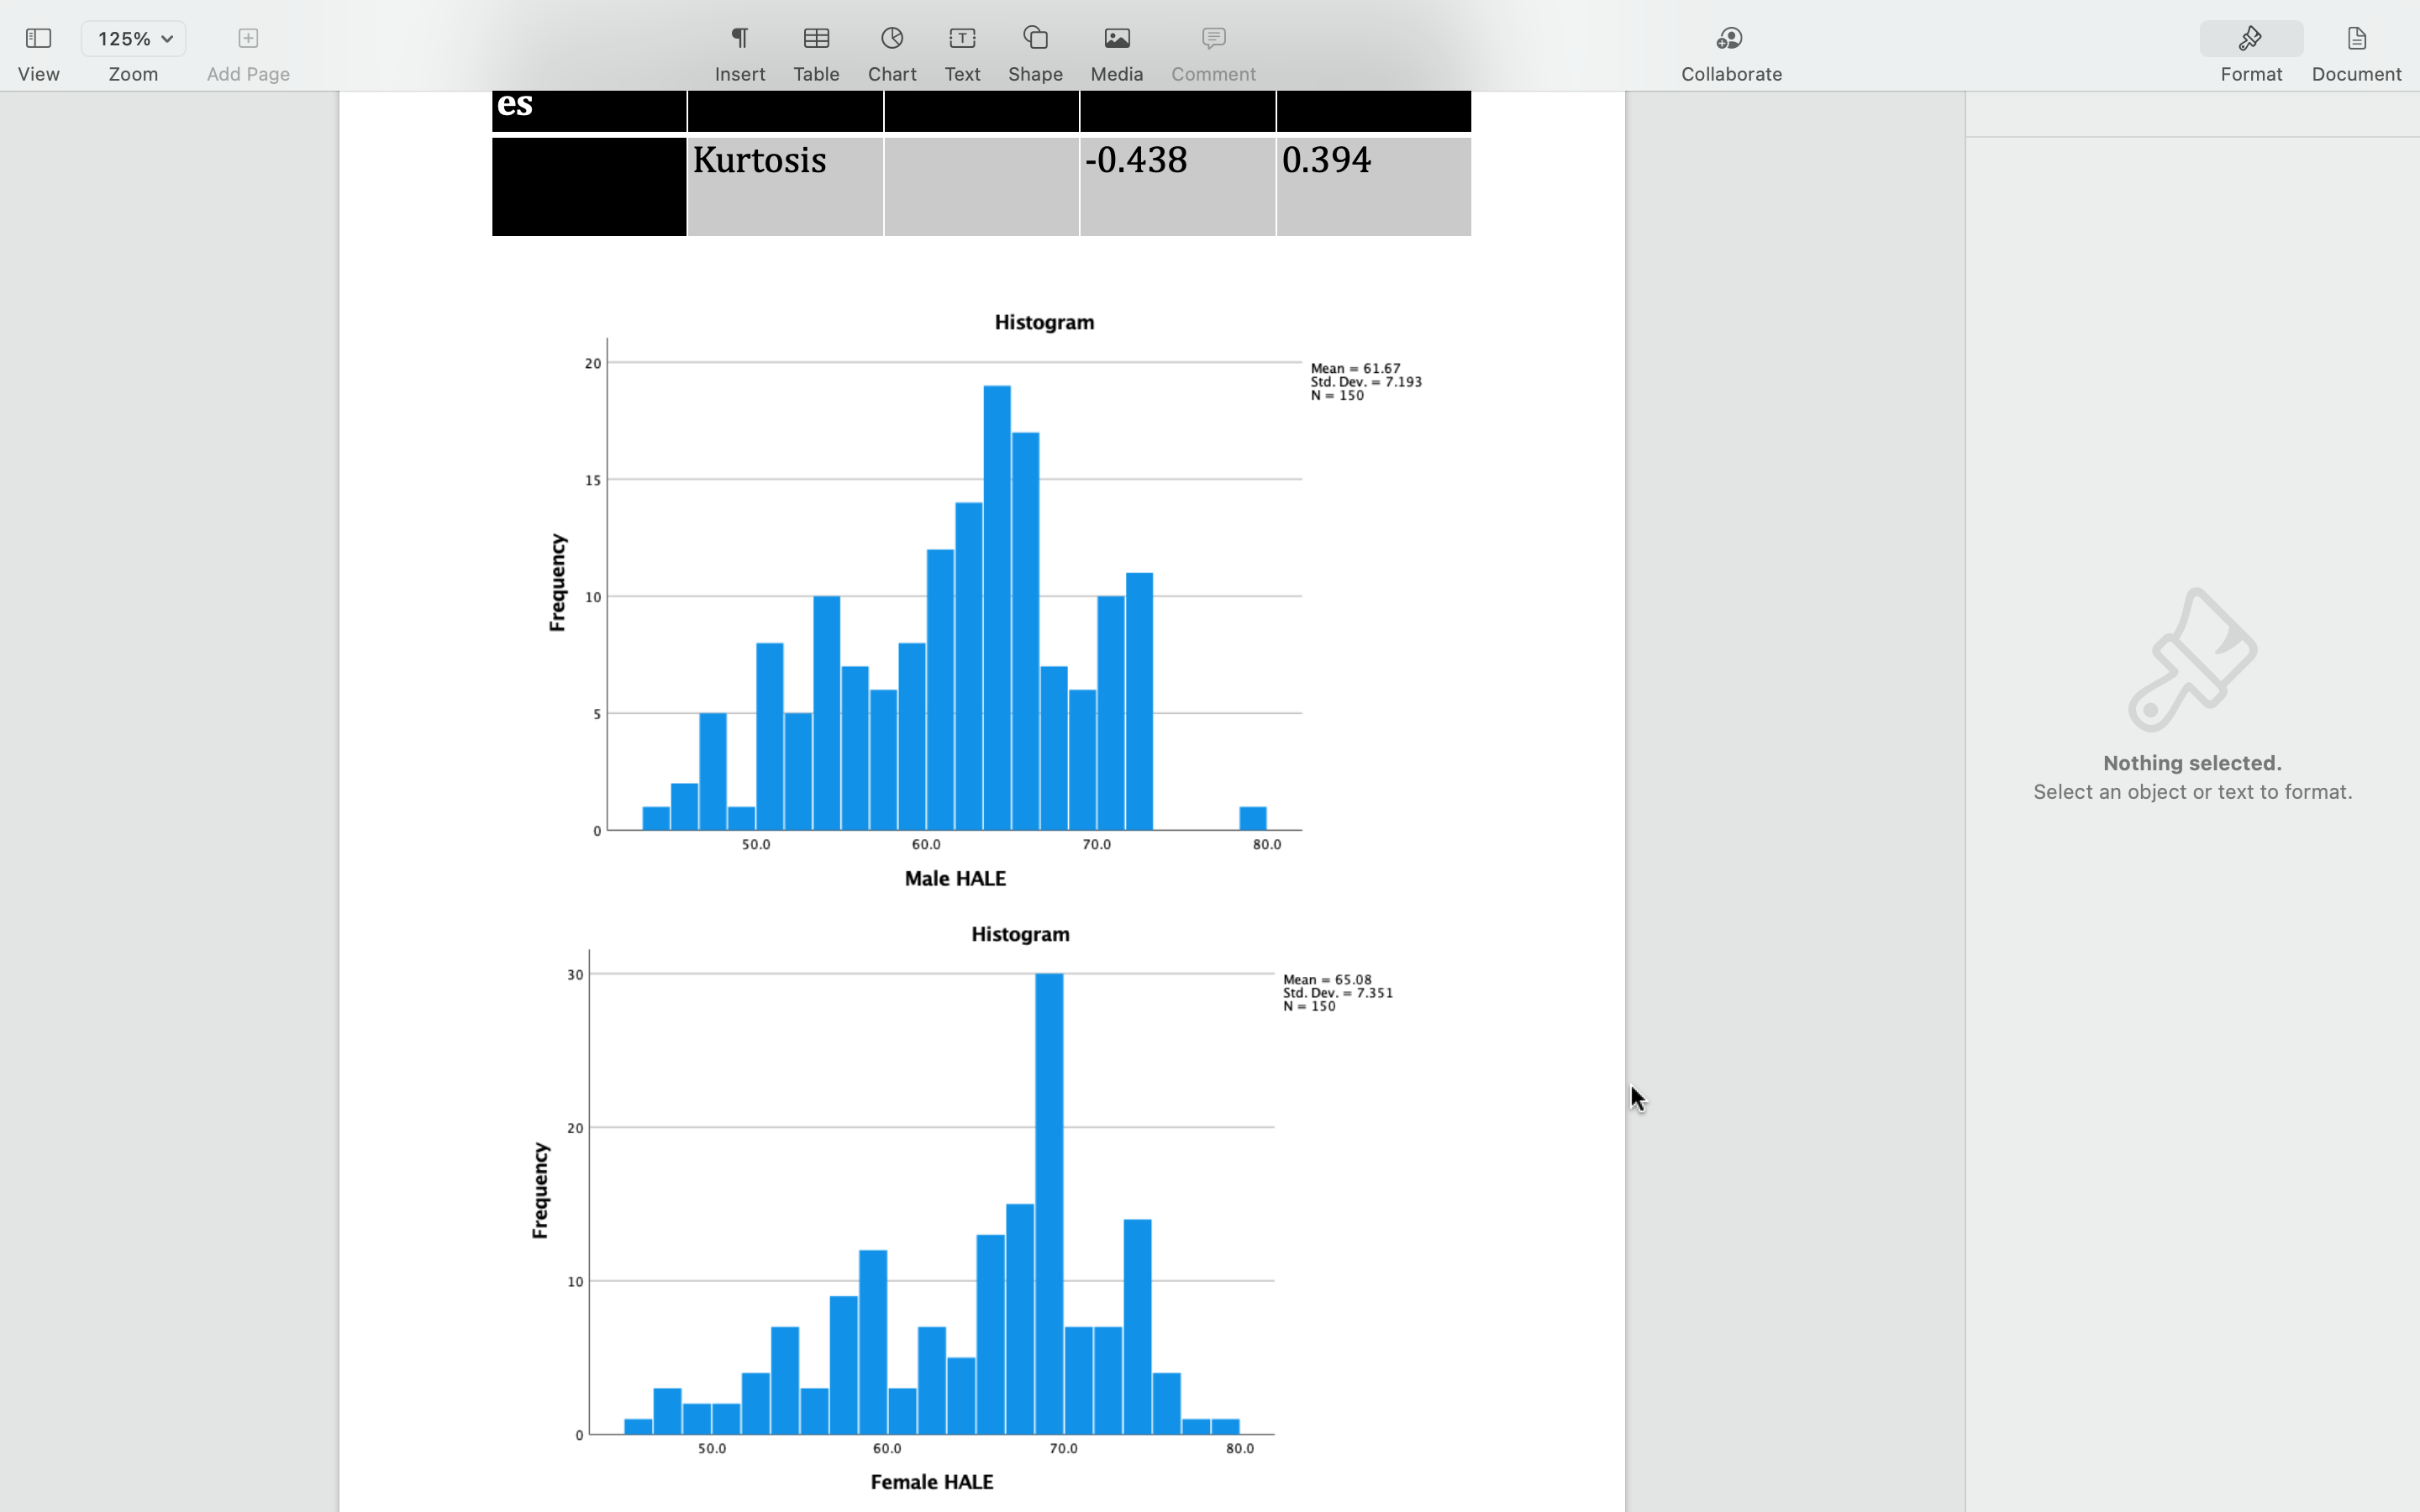
- On average, which group/sex tend to have longer HALE and which sex's average HALE scores are more varied/spread-out compared to the other?? (1 point)
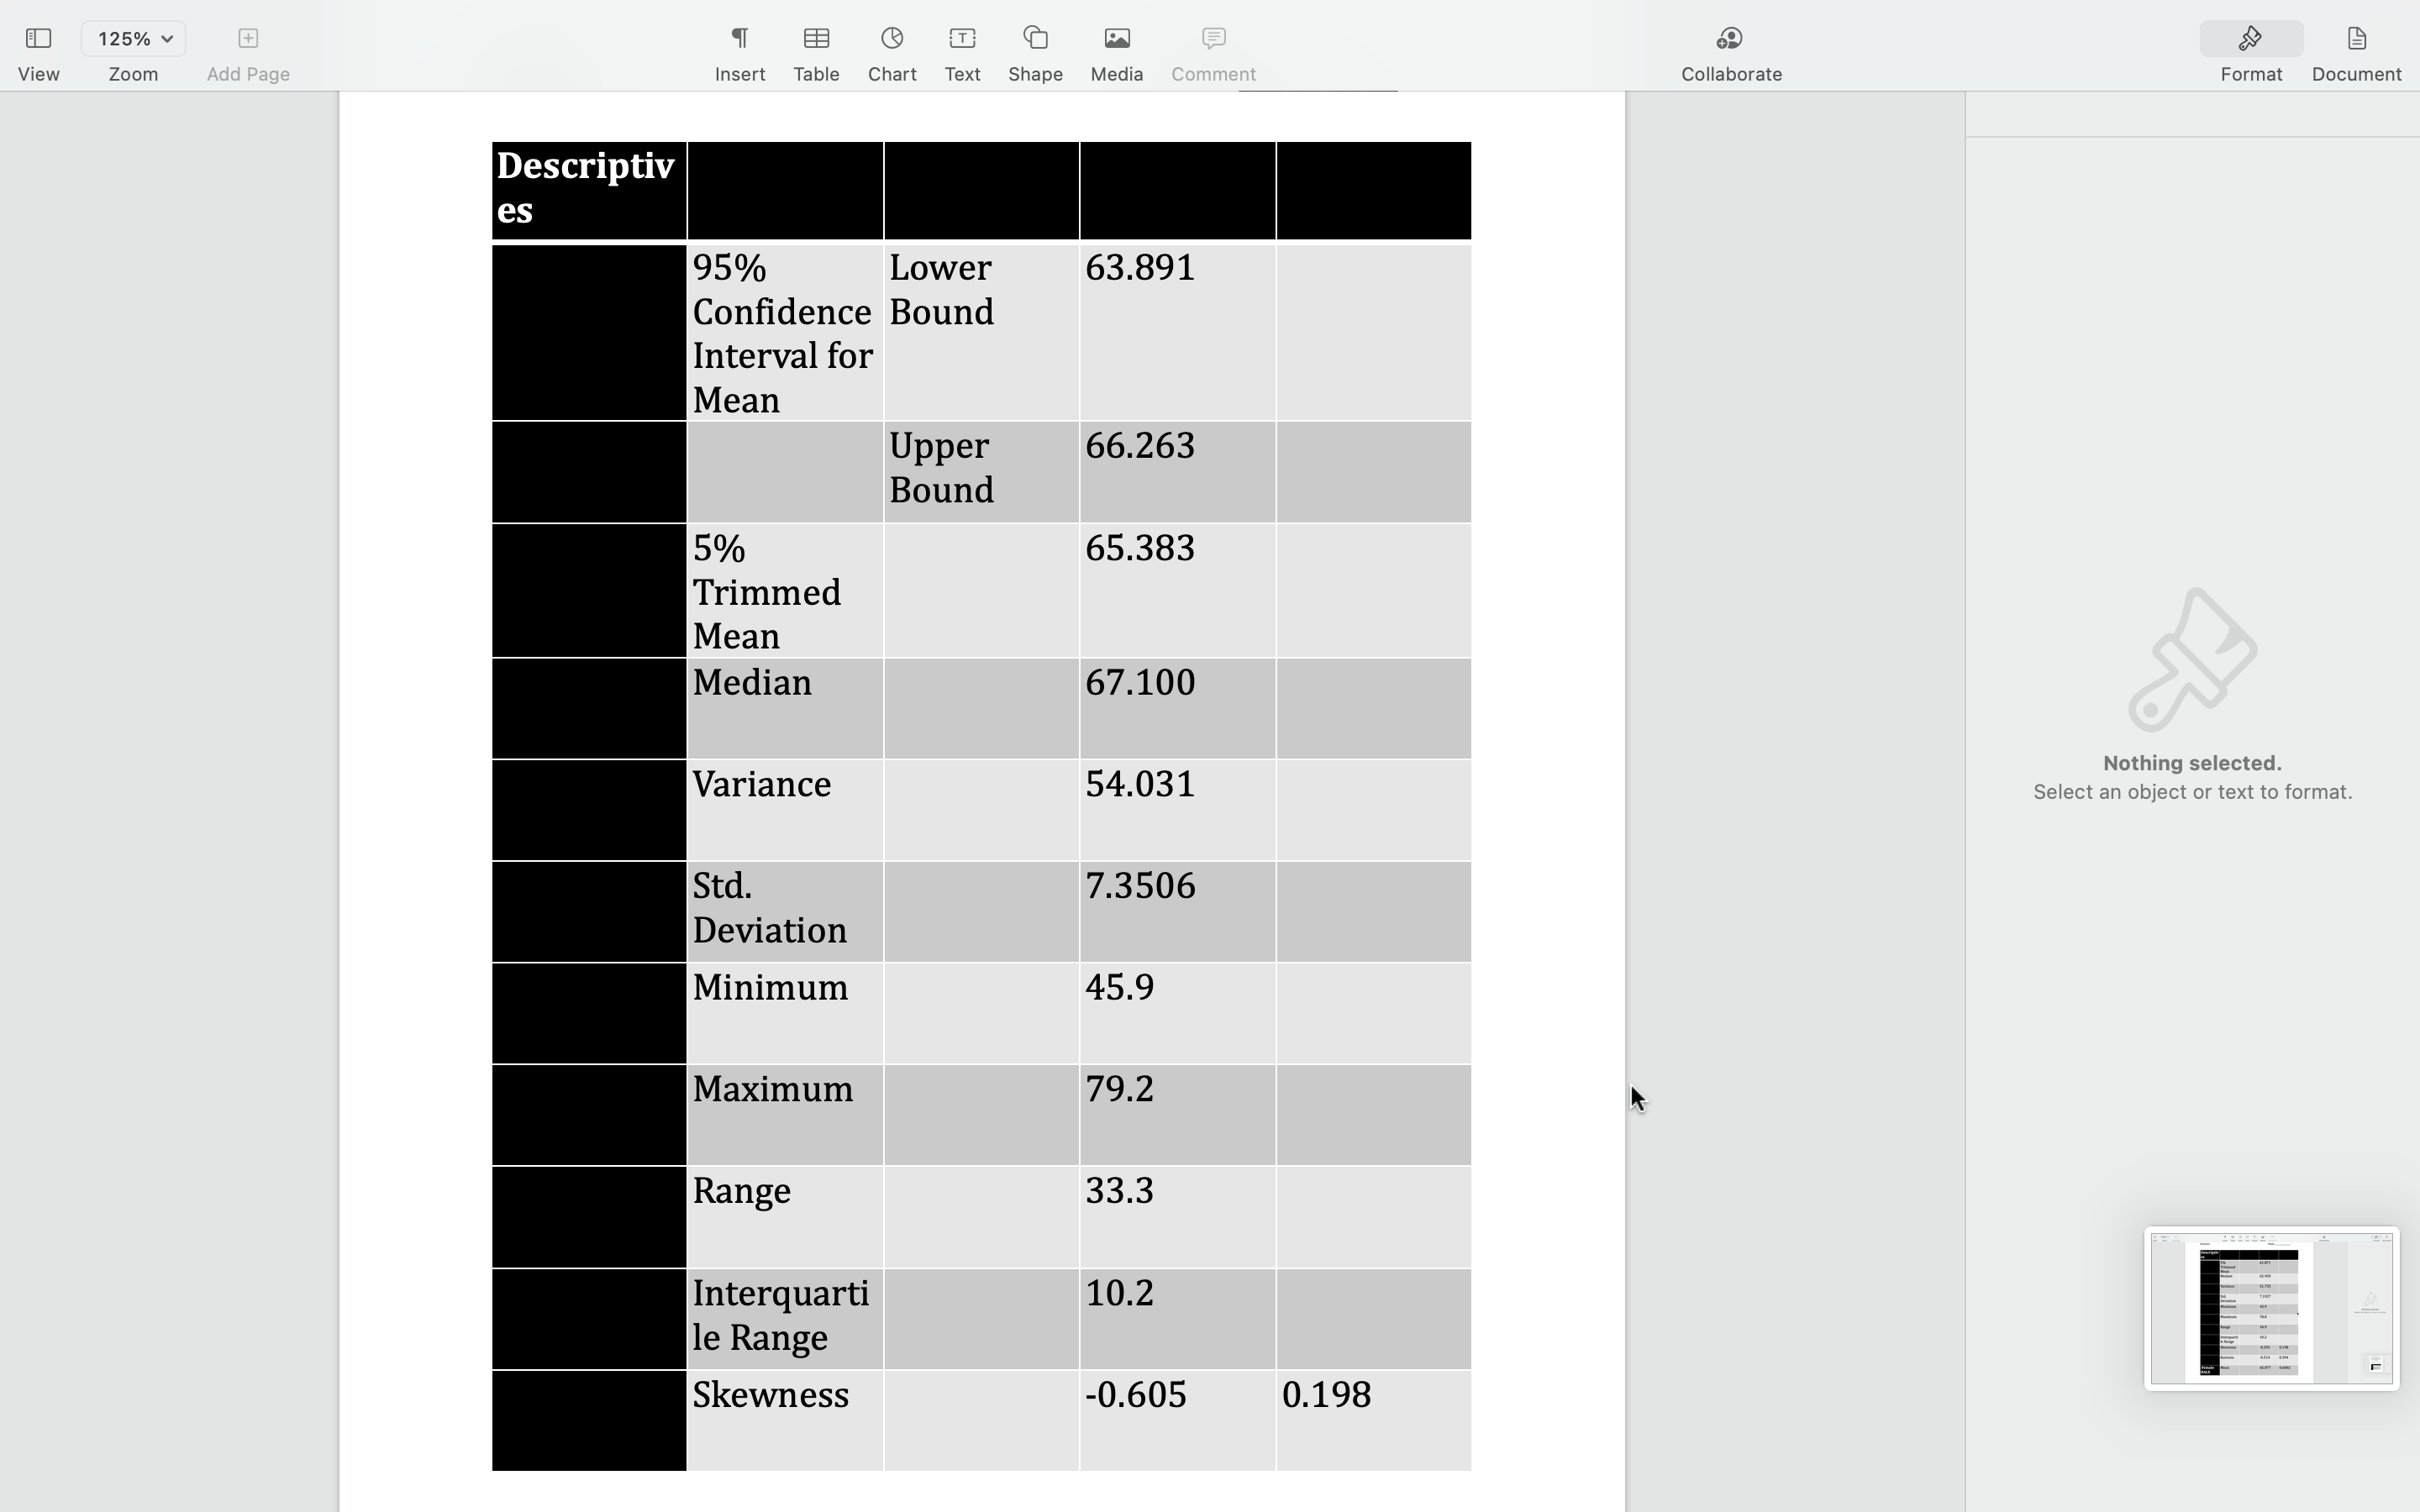
- Compared to normal distribution, how would you characterize the distribution of the HALE scores for each sex? (1 point)
- .What are the 95% confidence intervals of the averages for each sex and what do they mean? (1 point)
- What percent of all countries have higher than an average of 58 years of healthy life expectancy at birth for men and women? (calculate one for each sex) (1 point)
- What percent of all countries have less than an average of 85 years of healthy life expectancy at birth for men and women? (1 point)
- .What percent ofall countries have less than an average of 50 years of healthy life expectancy at birth for men and women? (calculate one for each sex) (1 point)
- What percent ofall countries have an average healthy life expectancy between 55 and 75 years of age for men and women? (calculate one for each sex) (1 point)
- Where does the United Kingdom's male and female HALE rank relative to other countries (find percentile ranking for each sex)? (1 point)
Step by Step Solution
There are 3 Steps involved in it
Step: 1

Get Instant Access to Expert-Tailored Solutions
See step-by-step solutions with expert insights and AI powered tools for academic success
Step: 2

Step: 3
Ace Your Homework with AI
Get the answers you need in no time with our AI-driven, step-by-step assistance
Get Started
Linear Algebra
Authors: Stephen H Friedberg, Arnold J Insel, Lawrence E Spence
4th Edition
0321998898, 9780321998897