PLease Answer
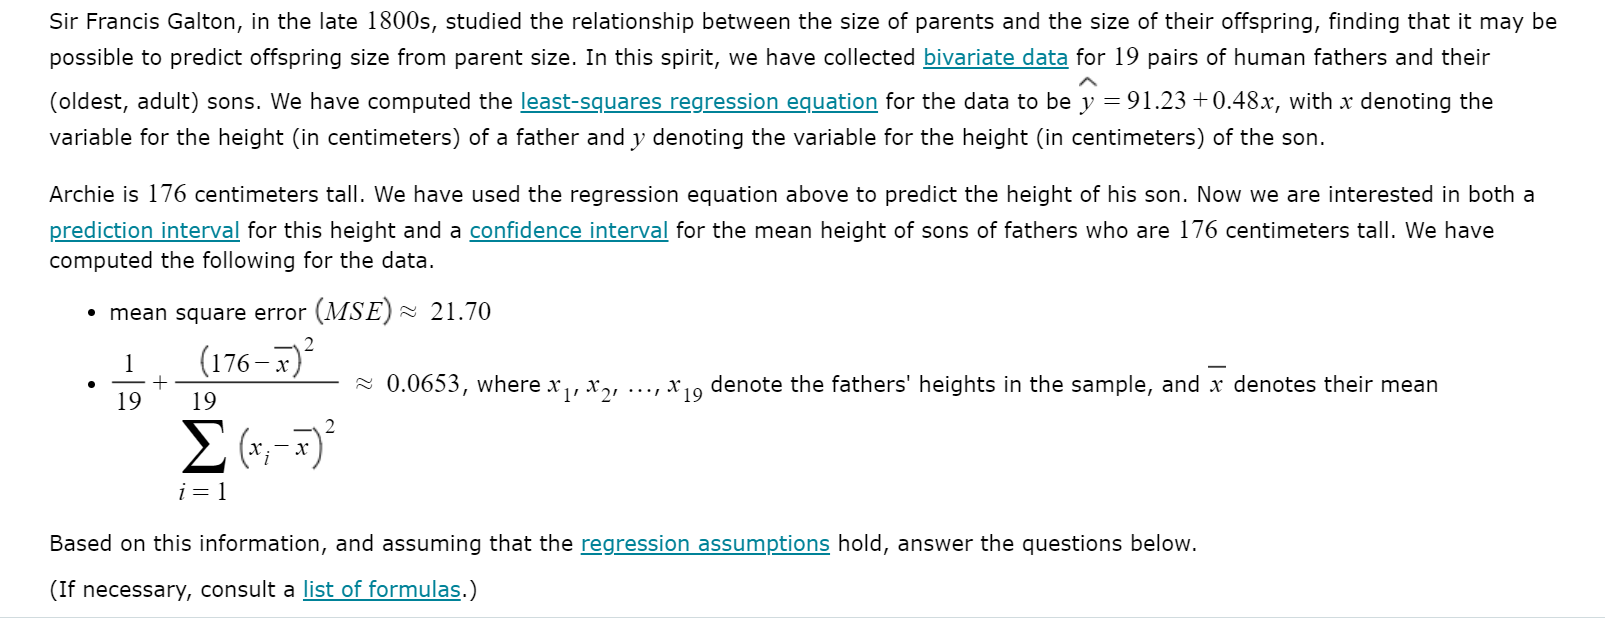
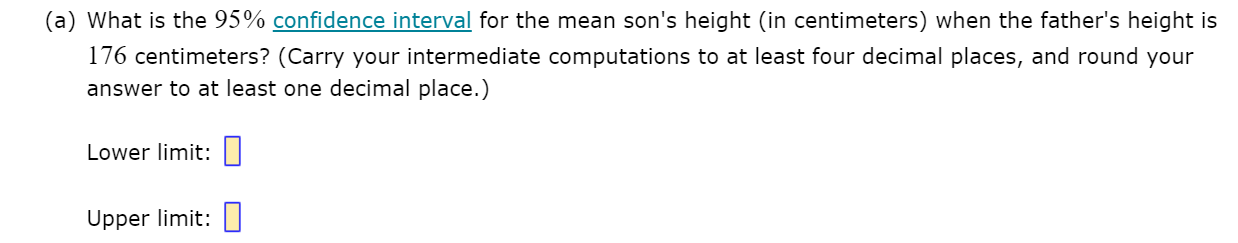
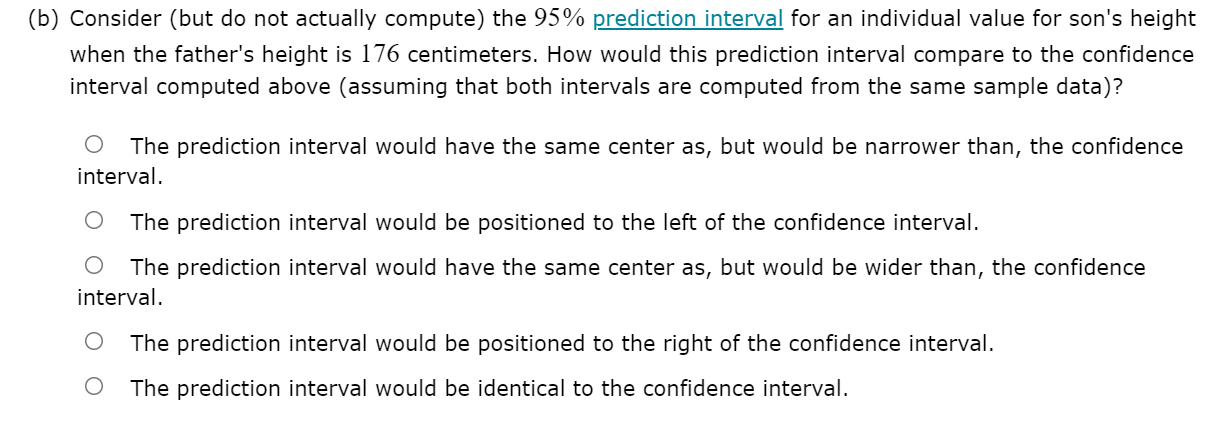
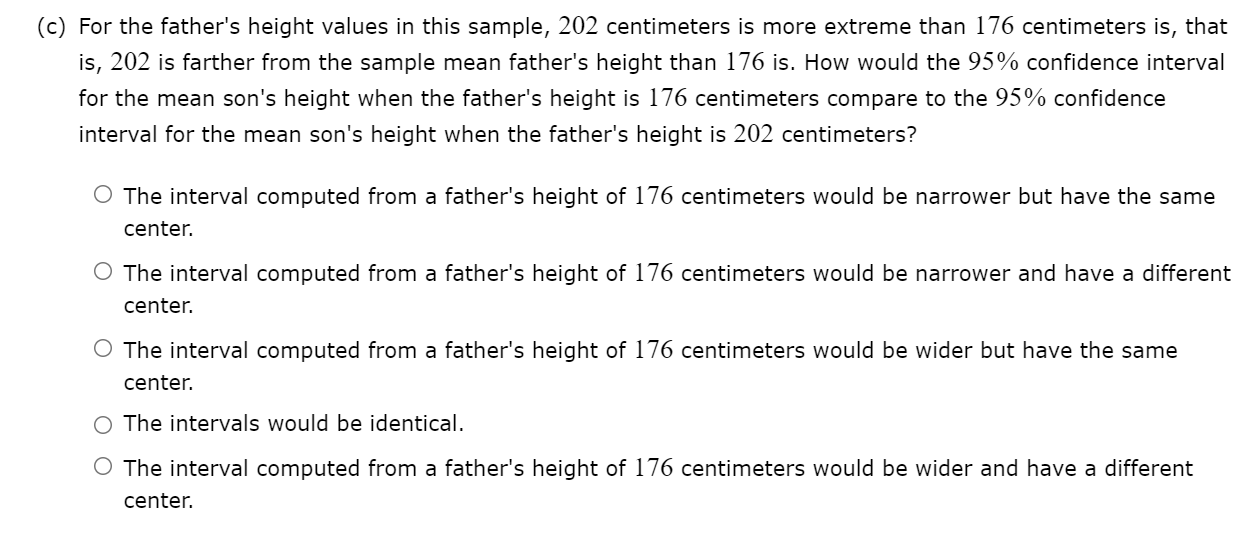
Sir Francis Galton, in the late 18005, studied the relationship between the size of parents and the size of their offspring, nding that it may be possible to predict offspring size from parent size. In this spirit, we have collected bivariate data for 19 pairs of human fathers and their A (oldest, adult) sons. We have computed the least-squares regression equation for the data to be y : 91.23 +0.48x, with x denoting the variable for the height (in centimeters) of a father and y denoting the variable for the height (in centimeters) of the son. Archie is 176 centimeters tall. We have used the regression equation above to predict the height of his son. Now we are interested in both a prediction interval for this height and a condence interval for the mean height of sons of fathers who are 176 centimeters tall. We have computed the following for the data. - mean square error (MSE) N 21.70 1 + (176732 19 z ( FE)? i=1 H 0.0653, where x1, x2, ..., x19 denote the fathers' heights in the sample, and ; denotes their mean Based on this information, and assuming that the Egression assumptions hold, answer the questions below. (If necessary, consult a list of formulas.) (a) What is the 95% confidence interval for the mean son's height (in centimeters) when the father's height is 176 centimeters? (Carry your intermediate computations to at least four decimal places, and round your answer to at least one decimal place.) Lower limit: I] Upper limit: I] (b) Consider (but do not actually compute) the 95% prediction interval for an individual value for son's height when the father's height is 176 centimeters. How would this prediction interval compare to the condence interval computed above (assuming that both intervals are computed from the same sample data)? 0 The prediction interval would have the same center as, but would be narrower than, the confidence interval. 0 The prediction interval would be positioned to the left of the confidence interval. 0 The prediction interval would have the same center as, but would be wider than, the confidence interval. O The prediction interval would be positioned to the right of the confidence interval. O The prediction interval would be identical to the condence interval. (c) For the father's height values in this sample, 202 centimeters is more extreme than 176 centimeters is, that is, 202 is farther from the sample mean father's height than 176 is. How would the 95% confidence interval for the mean son's height when the father's height is 176 centimeters compare to the 95% confidence interval for the mean son's height when the father's height is 202 centimeters? O The interval computed from a father's height of 176 centimeters would be narrower but have the same center. 0 The interval computed from a father's height of 176 centimeters would be narrower and have a different center. 0 The interval computed from a father's height of 176 centimeters would be wider but have the same center. 0 The intervals would be identical. 0 The interval computed from a father's height of 176 centimeters would be wider and have a different center