

Answered step by step
Verified Expert Solution
Question
1 Approved Answer
please answer solution of all three questions... I'll give you up thumb definitely The Elasticity of Demand for Health Care A Review of the Literature
please answer solution of all three questions... I'll give you up thumb definitely
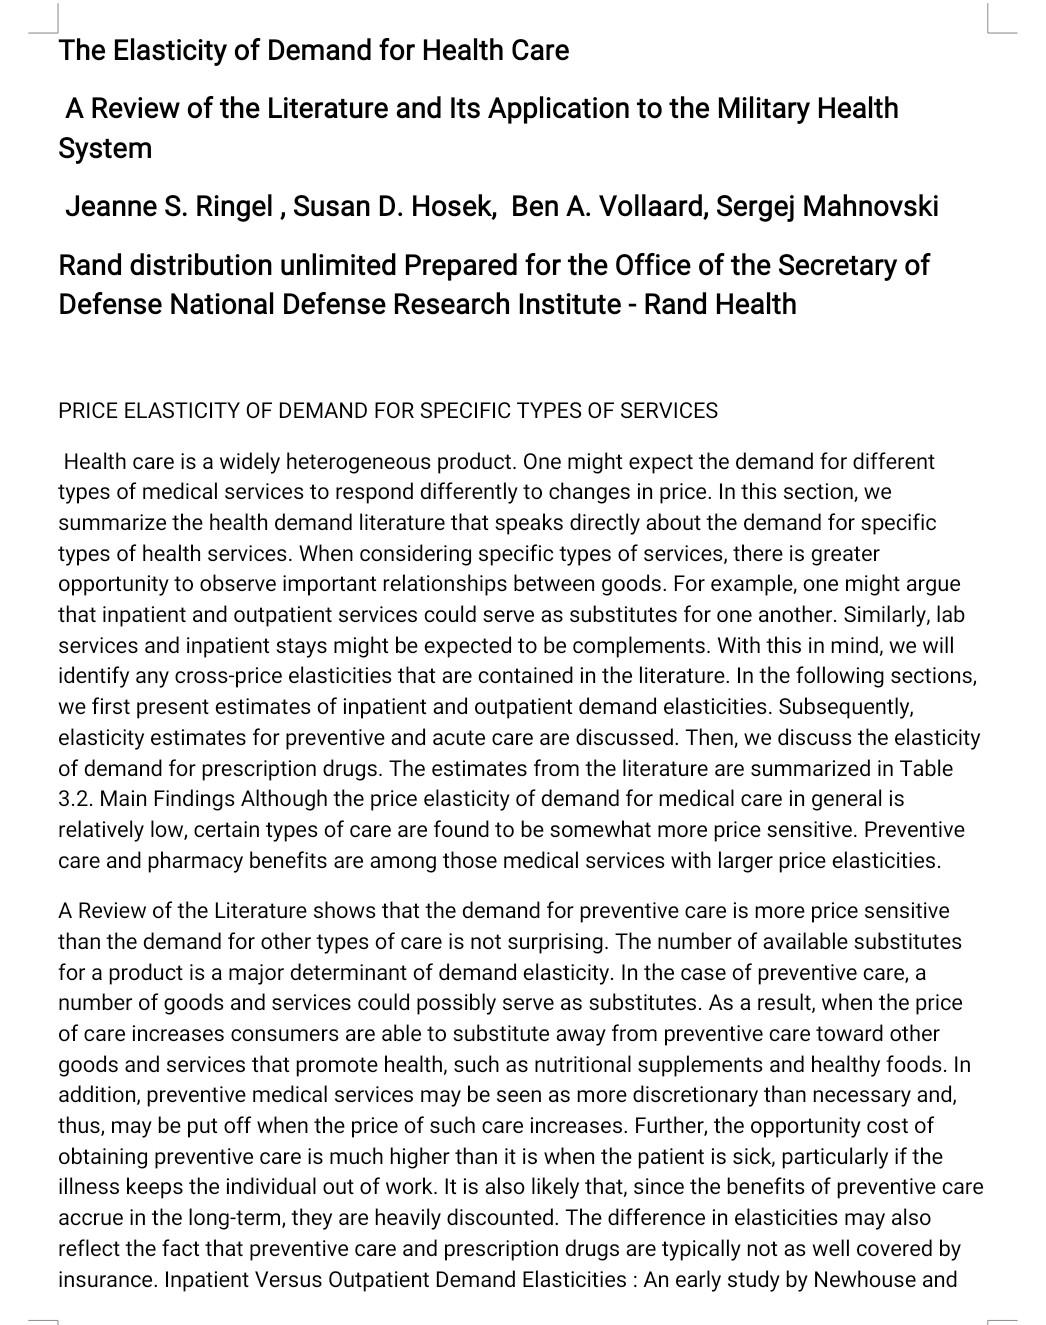
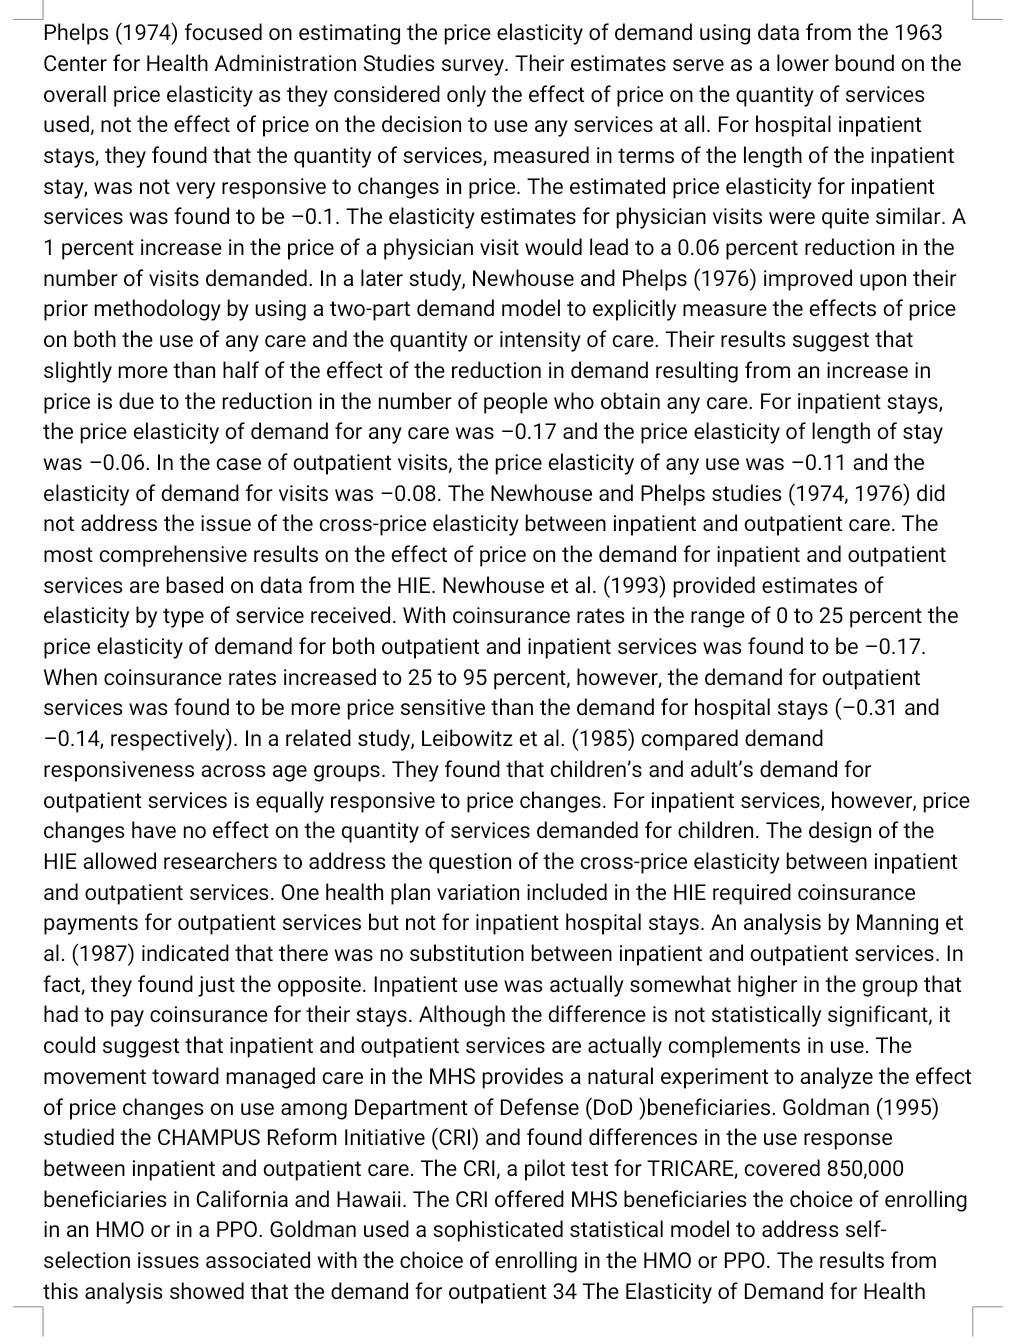
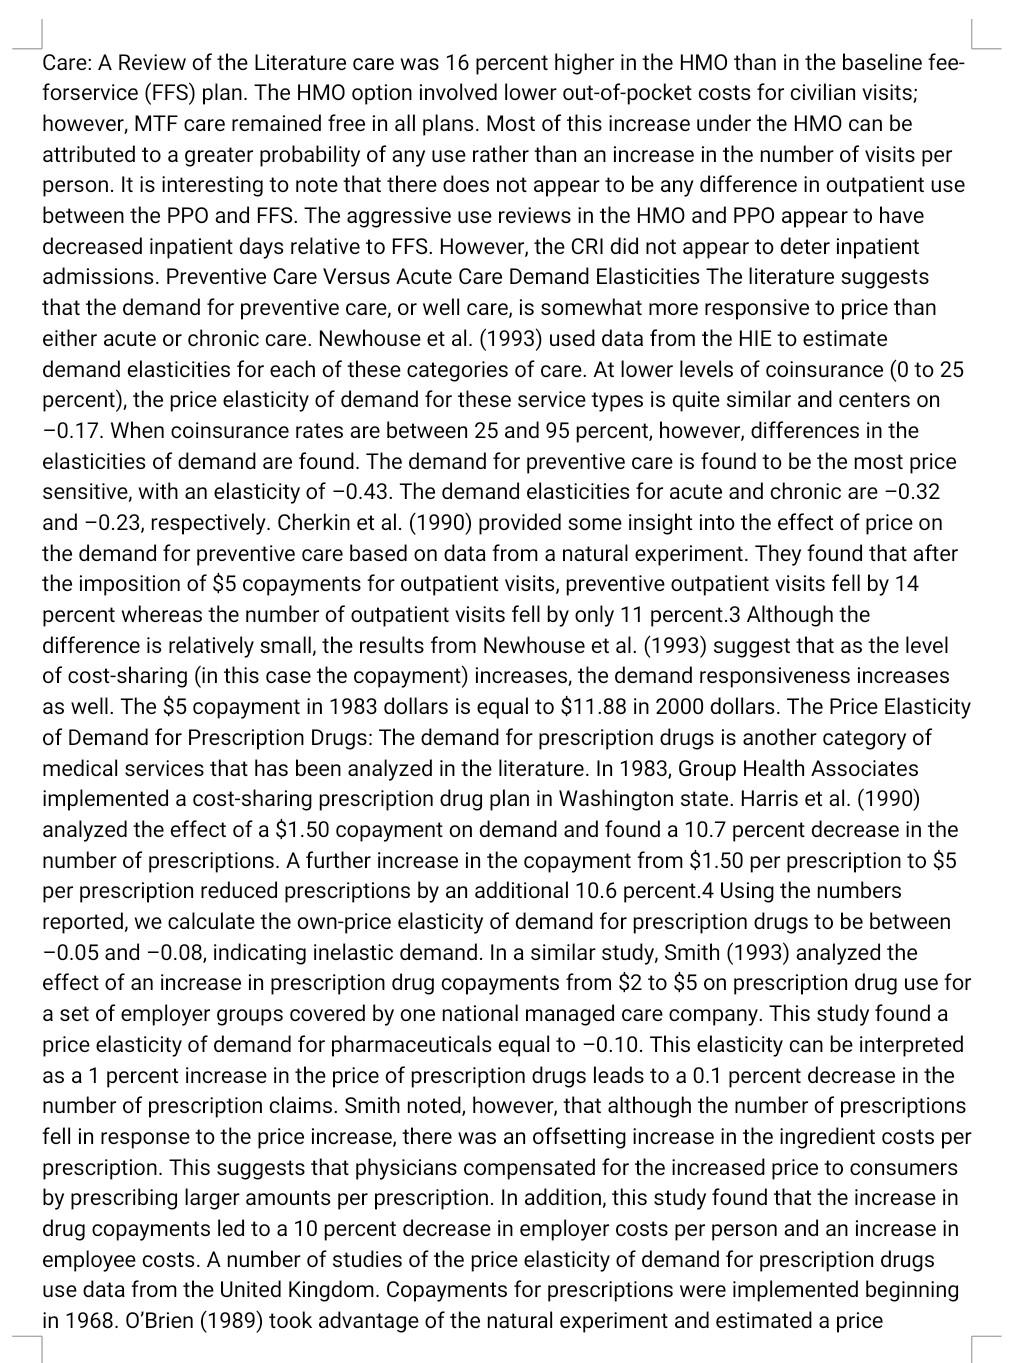
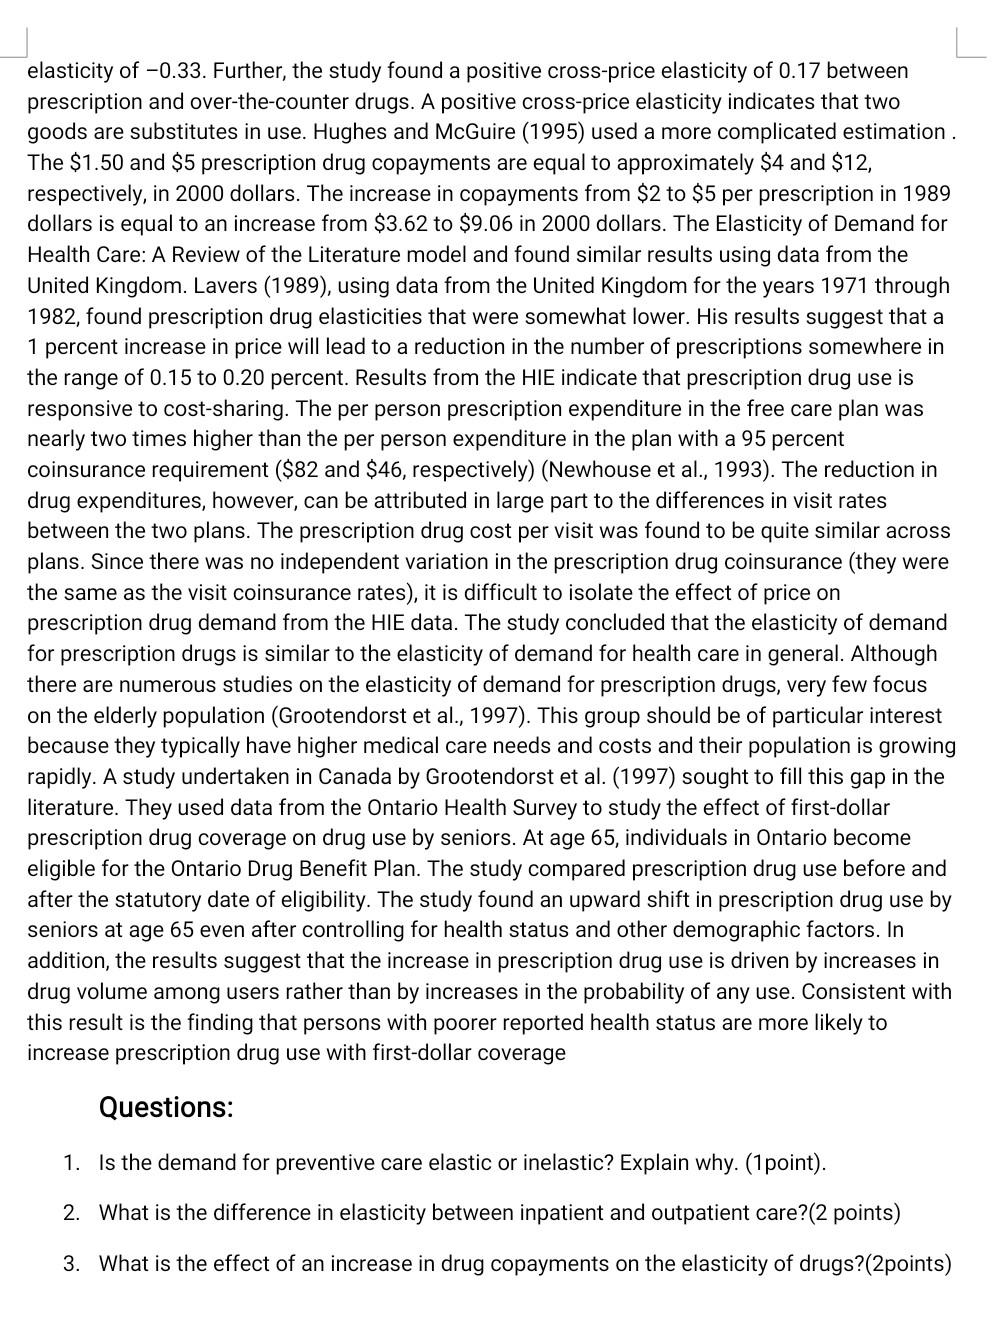
The Elasticity of Demand for Health Care A Review of the Literature and Its Application to the Military Health System Jeanne S. Ringel, Susan D. Hosek, Ben A. Vollaard, Sergej Mahnovski Rand distribution unlimited Prepared for the Office of the Secretary of Defense National Defense Research Institute - Rand Health PRICE ELASTICITY OF DEMAND FOR SPECIFIC TYPES OF SERVICES Health care is a widely heterogeneous product. One might expect the demand for different types of medical services to respond differently to changes in price. In this section, we summarize the health demand literature that speaks directly about the demand for specific types of health services. When considering specific types of services, there is greater opportunity to observe important relationships between goods. For example, one might argue that inpatient and outpatient services could serve as substitutes for one another. Similarly, lab services and inpatient stays might be expected to be complements. With this in mind, we will identify any cross-price elasticities that are contained in the literature. In the following sections, we first present estimates of inpatient and outpatient demand elasticities. Subsequently, elasticity estimates for preventive and acute care are discussed. Then, we discuss the elasticity of demand for prescription drugs. The estimates from the literature are summarized in Table 3.2. Main Findings Although the price elasticity of demand for medical care in general is relatively low, certain types of care are found to be somewhat more price sensitive. Preventive care and pharmacy benefits are among those medical services with larger price elasticities. A Review of the Literature shows that the demand for preventive care is more price sensitive than the demand for other types of care is not surprising. The number of available substitutes for a product is a major determinant of demand elasticity. In the case of preventive care, a number of goods and services could possibly serve as substitutes. As a result, when the price of care increases consumers are able to substitute away from preventive care toward other goods and services that promote health, such as nutritional supplements and healthy foods. In addition, preventive medical services may be seen as more discretionary than necessary and, thus, may be put off when the price of such care increases. Further, the opportunity cost of obtaining preventive care is much higher than it is when the patient is sick, particularly if the illness keeps the individual out of work. It is also likely that, since the benefits of preventive care accrue in the long-term, they are heavily discounted. The difference in elasticities may also reflect the fact that preventive care and prescription drugs are typically not as well covered by insurance. Inpatient Versus Outpatient Demand Elasticities : An early study by Newhouse and _ Phelps (1974) focused on estimating the price elasticity of demand using data from the 1963 Center for Health Administration Studies survey. Their estimates serve as a lower bound on the overall price elasticity as they considered only the effect of price on the quantity of services used, not the effect of price on the decision to use any services at all. For hospital inpatient stays, they found that the quantity of services, measured in terms of the length of the inpatient stay, was not very responsive to changes in price. The estimated price elasticity for inpatient services was found to be -0.1. The elasticity estimates for physician visits were quite similar. A 1 percent increase in the price of a physician visit would lead to a 0.06 percent reduction in the number of visits demanded. In a later study, Newhouse and Phelps (1976) improved upon their prior methodology by using a two-part demand model to explicitly measure the effects of price on both the use of any care and the quantity or intensity of care. Their results suggest that slightly more than half of the effect of the reduction in demand resulting from an increase in price is due to the reduction in the number of people who obtain any care. For inpatient stays, the price elasticity of demand for any care was -0.17 and the price elasticity of length of stay was -0.06. In the case of outpatient visits, the price elasticity of any use was -0.11 and the elasticity of demand for visits was -0.08. The Newhouse and Phelps studies (1974, 1976) did not address the issue of the cross-price elasticity between inpatient and outpatient care. The most comprehensive results on the effect of price on the demand for inpatient and outpatient services are based on data from the HIE. Newhouse et al. (1993) provided estimates of elasticity by type of service received. With coinsurance rates in the range of 0 to 25 percent the price elasticity of demand for both outpatient and inpatient services was found to be -0.17. When coinsurance rates increased to 25 to 95 percent, however, the demand for outpatient services was found to be more price sensitive than the demand for hospital stays (-0.31 and -0.14, respectively). In a related study, Leibowitz et al. (1985) compared demand responsiveness across age groups. They found that children's and adult's demand for outpatient services is equally responsive to price changes. For inpatient services, however, price changes have no effect on the quantity of services demanded for children. The design of the HIE allowed researchers to address the question of the cross-price elasticity between inpatient and outpatient services. One health plan variation included in the HIE required coinsurance payments for outpatient services but not for inpatient hospital stays. An analysis by Manning et al. (1987) indicated that there was no substitution between inpatient and outpatient services. In fact, they found just the opposite. Inpatient use was actually somewhat higher in the group that had to pay coinsurance for their stays. Although the difference is not statistically significant, it could suggest that inpatient and outpatient services are actually complements in use. The movement toward managed care in the MHS provides a natural experiment to analyze the effect of price changes on use among Department of Defense (DoD )beneficiaries. Goldman (1995) studied the CHAMPUS Reform Initiative (CRI) and found differences in the use response between inpatient and outpatient care. The CRI, a pilot test for TRICARE, covered 850,000 beneficiaries in California and Hawaii. The CRI offered MHS beneficiaries the choice of enrolling in an HMO or in a PPO. Goldman used a sophisticated statistical model to address self- selection issues associated with the choice of enrolling in the HMO or PPO. The results from this analysis showed that the demand for outpatient 34 The Elasticity of Demand for Health Care: A Review of the Literature care was 16 percent higher in the HMO than in the baseline fee- forservice (FFS) plan. The HMO option involved lower out-of-pocket costs for civilian visits; however, MTF care remained free in all plans. Most of this increase under the HMO can be attributed to a greater probability of any use rather than an increase in the number of visits per person. It is interesting to note that there does not appear to be any difference in outpatient use between the PPO and FFS. The aggressive use reviews in the HMO and PPO appear to have decreased inpatient days relative to FFS. However, the CRI did not appear to deter inpatient admissions. Preventive Care Versus Acute Care Demand Elasticities The literature suggests that the demand for preventive care, or well care, is somewhat more responsive to price than either acute or chronic care. Newhouse et al. (1993) used data from the HIE to estimate demand elasticities for each of these categories of care. At lower levels of coinsurance (0 to 25 percent), the price elasticity of demand for these service types is quite similar and centers on -0.17. When coinsurance rates are between 25 and 95 percent, however, differences in the elasticities of demand are found. The demand for preventive care is found to be the most price sensitive, with an elasticity of -0.43. The demand elasticities for acute and chronic are -0.32 and -0.23, respectively. Cherkin et al. (1990) provided some insight into the effect of price on the demand for preventive care based on data from a natural experiment. They found that after the imposition of $5 copayments for outpatient visits, preventive outpatient visits fell by 14 percent whereas the number of outpatient visits fell by only 11 percent.3 Although the difference is relatively small, the results from Newhouse et al. (1993) suggest that as the level of cost-sharing (in this case the copayment) increases, the demand responsiveness increases as well. The $5 copayment in 1983 dollars is equal to $11.88 in 2000 dollars. The Price Elasticity of Demand for Prescription Drugs: The demand for prescription drugs is another category of medical services that has been analyzed in the literature. In 1983, Group Health Associates implemented a cost-sharing prescription drug plan in Washington state. Harris et al. (1990) analyzed the effect of a $1.50 copayment on demand and found a 10.7 percent decrease in the number of prescriptions. A further increase in the copayment from $1.50 per prescription to $5 per prescription reduced prescriptions by an additional 10.6 percent.4 Using the numbers reported, we calculate the own-price elasticity of demand for prescription drugs to be between -0.05 and -0.08, indicating inelastic demand. In a similar study, Smith (1993) analyzed the effect of an increase in prescription drug copayments from $2 to $5 on prescription drug use for a set of employer groups covered by one national managed care company. This study found a price elasticity of demand for pharmaceuticals equal to -0.10. This elasticity can be interpreted as a 1 percent increase in the price of prescription drugs leads to a 0.1 percent decrease in the number of prescription claims. Smith noted, however, that although the number of prescriptions fell in response to the price increase, there was an offsetting increase in the ingredient costs per prescription. This suggests that physicians compensated for the increased price to consumers by prescribing larger amounts per prescription. In addition, this study found that the increase in drug copayments led to a 10 percent decrease in employer costs per person and an increase in employee costs. A number of studies of the price elasticity of demand for prescription drugs use data from the United Kingdom. Copayments for prescriptions were implemented beginning in 1968. O'Brien (1989) took advantage of the natural experiment and estimated a price elasticity of -0.33. Further, the study found a positive cross-price elasticity of 0.17 between prescription and over-the-counter drugs. A positive cross-price elasticity indicates that two goods are substitutes in use. Hughes and McGuire (1995) used a more complicated estimation. The $1.50 and $5 prescription drug copayments are equal to approximately $4 and $12, respectively, in 2000 dollars. The increase in copayments from $2 to $5 per prescription in 1989 dollars is equal to an increase from $3.62 to $9.06 in 2000 dollars. The Elasticity of Demand for Health Care: A Review of the Literature model and found similar results using data from the United Kingdom. Lavers (1989), using data from the United Kingdom for the years 1971 through 1982, found prescription drug elasticities that were somewhat lower. His results suggest that a 1 percent increase in price will lead to a reduction in the number of prescriptions somewhere in the range of 0.15 to 0.20 percent. Results from the HIE indicate that prescription drug use is responsive to cost-sharing. The per person prescription expenditure in the free care plan was nearly two times higher than the per person expenditure in the plan with a 95 percent coinsurance requirement ($82 and $46, respectively) (Newhouse et al., 1993). The reduction in drug expenditures, however, can be attributed in large part to the differences in visit rates between the two plans. The prescription drug cost per visit was found to be quite similar across plans. Since there was no independent variation in the prescription drug coinsurance (they were the same as the visit coinsurance rates), it is difficult to isolate the effect of price on prescription drug demand from the HIE data. The study concluded that the elasticity of demand for prescription drugs is similar to the elasticity of demand for health care in general. Although there are numerous studies on the elasticity of demand for prescription drugs, very few focus on the elderly population (Grootendorst et al., 1997). This group should be of particular interest because they typically have higher medical care needs and costs and their population is growing rapidly. A study undertaken in Canada by Grootendorst et al. (1997) sought to fill this gap in the literature. They used data from the Ontario Health Survey to study the effect of first-dollar prescription drug coverage on drug use by seniors. At age 65, individuals in Ontario become eligible for the Ontario Drug Benefit Plan. The study compared prescription drug use before and after the statutory date of eligibility. The study found an upward shift in prescription drug use by seniors at age 65 even after controlling for health status and other demographic factors. In addition, the results suggest that the increase in prescription drug use is driven by increases in drug volume among users rather than by increases in the probability of any use. Consistent with this result is the finding that persons with poorer reported health status are more likely to increase prescription drug use with first-dollar coverage Questions: 1. Is the demand for preventive care elastic or inelastic? Explain why. (1point). 2. What is the difference in elasticity between inpatient and outpatient care?(2 points) 3. What is the effect of an increase in drug copayments on the elasticity of drugs?(2points) The Elasticity of Demand for Health Care A Review of the Literature and Its Application to the Military Health System Jeanne S. Ringel, Susan D. Hosek, Ben A. Vollaard, Sergej Mahnovski Rand distribution unlimited Prepared for the Office of the Secretary of Defense National Defense Research Institute - Rand Health PRICE ELASTICITY OF DEMAND FOR SPECIFIC TYPES OF SERVICES Health care is a widely heterogeneous product. One might expect the demand for different types of medical services to respond differently to changes in price. In this section, we summarize the health demand literature that speaks directly about the demand for specific types of health services. When considering specific types of services, there is greater opportunity to observe important relationships between goods. For example, one might argue that inpatient and outpatient services could serve as substitutes for one another. Similarly, lab services and inpatient stays might be expected to be complements. With this in mind, we will identify any cross-price elasticities that are contained in the literature. In the following sections, we first present estimates of inpatient and outpatient demand elasticities. Subsequently, elasticity estimates for preventive and acute care are discussed. Then, we discuss the elasticity of demand for prescription drugs. The estimates from the literature are summarized in Table 3.2. Main Findings Although the price elasticity of demand for medical care in general is relatively low, certain types of care are found to be somewhat more price sensitive. Preventive care and pharmacy benefits are among those medical services with larger price elasticities. A Review of the Literature shows that the demand for preventive care is more price sensitive than the demand for other types of care is not surprising. The number of available substitutes for a product is a major determinant of demand elasticity. In the case of preventive care, a number of goods and services could possibly serve as substitutes. As a result, when the price of care increases consumers are able to substitute away from preventive care toward other goods and services that promote health, such as nutritional supplements and healthy foods. In addition, preventive medical services may be seen as more discretionary than necessary and, thus, may be put off when the price of such care increases. Further, the opportunity cost of obtaining preventive care is much higher than it is when the patient is sick, particularly if the illness keeps the individual out of work. It is also likely that, since the benefits of preventive care accrue in the long-term, they are heavily discounted. The difference in elasticities may also reflect the fact that preventive care and prescription drugs are typically not as well covered by insurance. Inpatient Versus Outpatient Demand Elasticities : An early study by Newhouse and _ Phelps (1974) focused on estimating the price elasticity of demand using data from the 1963 Center for Health Administration Studies survey. Their estimates serve as a lower bound on the overall price elasticity as they considered only the effect of price on the quantity of services used, not the effect of price on the decision to use any services at all. For hospital inpatient stays, they found that the quantity of services, measured in terms of the length of the inpatient stay, was not very responsive to changes in price. The estimated price elasticity for inpatient services was found to be -0.1. The elasticity estimates for physician visits were quite similar. A 1 percent increase in the price of a physician visit would lead to a 0.06 percent reduction in the number of visits demanded. In a later study, Newhouse and Phelps (1976) improved upon their prior methodology by using a two-part demand model to explicitly measure the effects of price on both the use of any care and the quantity or intensity of care. Their results suggest that slightly more than half of the effect of the reduction in demand resulting from an increase in price is due to the reduction in the number of people who obtain any care. For inpatient stays, the price elasticity of demand for any care was -0.17 and the price elasticity of length of stay was -0.06. In the case of outpatient visits, the price elasticity of any use was -0.11 and the elasticity of demand for visits was -0.08. The Newhouse and Phelps studies (1974, 1976) did not address the issue of the cross-price elasticity between inpatient and outpatient care. The most comprehensive results on the effect of price on the demand for inpatient and outpatient services are based on data from the HIE. Newhouse et al. (1993) provided estimates of elasticity by type of service received. With coinsurance rates in the range of 0 to 25 percent the price elasticity of demand for both outpatient and inpatient services was found to be -0.17. When coinsurance rates increased to 25 to 95 percent, however, the demand for outpatient services was found to be more price sensitive than the demand for hospital stays (-0.31 and -0.14, respectively). In a related study, Leibowitz et al. (1985) compared demand responsiveness across age groups. They found that children's and adult's demand for outpatient services is equally responsive to price changes. For inpatient services, however, price changes have no effect on the quantity of services demanded for children. The design of the HIE allowed researchers to address the question of the cross-price elasticity between inpatient and outpatient services. One health plan variation included in the HIE required coinsurance payments for outpatient services but not for inpatient hospital stays. An analysis by Manning et al. (1987) indicated that there was no substitution between inpatient and outpatient services. In fact, they found just the opposite. Inpatient use was actually somewhat higher in the group that had to pay coinsurance for their stays. Although the difference is not statistically significant, it could suggest that inpatient and outpatient services are actually complements in use. The movement toward managed care in the MHS provides a natural experiment to analyze the effect of price changes on use among Department of Defense (DoD )beneficiaries. Goldman (1995) studied the CHAMPUS Reform Initiative (CRI) and found differences in the use response between inpatient and outpatient care. The CRI, a pilot test for TRICARE, covered 850,000 beneficiaries in California and Hawaii. The CRI offered MHS beneficiaries the choice of enrolling in an HMO or in a PPO. Goldman used a sophisticated statistical model to address self- selection issues associated with the choice of enrolling in the HMO or PPO. The results from this analysis showed that the demand for outpatient 34 The Elasticity of Demand for Health Care: A Review of the Literature care was 16 percent higher in the HMO than in the baseline fee- forservice (FFS) plan. The HMO option involved lower out-of-pocket costs for civilian visits; however, MTF care remained free in all plans. Most of this increase under the HMO can be attributed to a greater probability of any use rather than an increase in the number of visits per person. It is interesting to note that there does not appear to be any difference in outpatient use between the PPO and FFS. The aggressive use reviews in the HMO and PPO appear to have decreased inpatient days relative to FFS. However, the CRI did not appear to deter inpatient admissions. Preventive Care Versus Acute Care Demand Elasticities The literature suggests that the demand for preventive care, or well care, is somewhat more responsive to price than either acute or chronic care. Newhouse et al. (1993) used data from the HIE to estimate demand elasticities for each of these categories of care. At lower levels of coinsurance (0 to 25 percent), the price elasticity of demand for these service types is quite similar and centers on -0.17. When coinsurance rates are between 25 and 95 percent, however, differences in the elasticities of demand are found. The demand for preventive care is found to be the most price sensitive, with an elasticity of -0.43. The demand elasticities for acute and chronic are -0.32 and -0.23, respectively. Cherkin et al. (1990) provided some insight into the effect of price on the demand for preventive care based on data from a natural experiment. They found that after the imposition of $5 copayments for outpatient visits, preventive outpatient visits fell by 14 percent whereas the number of outpatient visits fell by only 11 percent.3 Although the difference is relatively small, the results from Newhouse et al. (1993) suggest that as the level of cost-sharing (in this case the copayment) increases, the demand responsiveness increases as well. The $5 copayment in 1983 dollars is equal to $11.88 in 2000 dollars. The Price Elasticity of Demand for Prescription Drugs: The demand for prescription drugs is another category of medical services that has been analyzed in the literature. In 1983, Group Health Associates implemented a cost-sharing prescription drug plan in Washington state. Harris et al. (1990) analyzed the effect of a $1.50 copayment on demand and found a 10.7 percent decrease in the number of prescriptions. A further increase in the copayment from $1.50 per prescription to $5 per prescription reduced prescriptions by an additional 10.6 percent.4 Using the numbers reported, we calculate the own-price elasticity of demand for prescription drugs to be between -0.05 and -0.08, indicating inelastic demand. In a similar study, Smith (1993) analyzed the effect of an increase in prescription drug copayments from $2 to $5 on prescription drug use for a set of employer groups covered by one national managed care company. This study found a price elasticity of demand for pharmaceuticals equal to -0.10. This elasticity can be interpreted as a 1 percent increase in the price of prescription drugs leads to a 0.1 percent decrease in the number of prescription claims. Smith noted, however, that although the number of prescriptions fell in response to the price increase, there was an offsetting increase in the ingredient costs per prescription. This suggests that physicians compensated for the increased price to consumers by prescribing larger amounts per prescription. In addition, this study found that the increase in drug copayments led to a 10 percent decrease in employer costs per person and an increase in employee costs. A number of studies of the price elasticity of demand for prescription drugs use data from the United Kingdom. Copayments for prescriptions were implemented beginning in 1968. O'Brien (1989) took advantage of the natural experiment and estimated a price elasticity of -0.33. Further, the study found a positive cross-price elasticity of 0.17 between prescription and over-the-counter drugs. A positive cross-price elasticity indicates that two goods are substitutes in use. Hughes and McGuire (1995) used a more complicated estimation. The $1.50 and $5 prescription drug copayments are equal to approximately $4 and $12, respectively, in 2000 dollars. The increase in copayments from $2 to $5 per prescription in 1989 dollars is equal to an increase from $3.62 to $9.06 in 2000 dollars. The Elasticity of Demand for Health Care: A Review of the Literature model and found similar results using data from the United Kingdom. Lavers (1989), using data from the United Kingdom for the years 1971 through 1982, found prescription drug elasticities that were somewhat lower. His results suggest that a 1 percent increase in price will lead to a reduction in the number of prescriptions somewhere in the range of 0.15 to 0.20 percent. Results from the HIE indicate that prescription drug use is responsive to cost-sharing. The per person prescription expenditure in the free care plan was nearly two times higher than the per person expenditure in the plan with a 95 percent coinsurance requirement ($82 and $46, respectively) (Newhouse et al., 1993). The reduction in drug expenditures, however, can be attributed in large part to the differences in visit rates between the two plans. The prescription drug cost per visit was found to be quite similar across plans. Since there was no independent variation in the prescription drug coinsurance (they were the same as the visit coinsurance rates), it is difficult to isolate the effect of price on prescription drug demand from the HIE data. The study concluded that the elasticity of demand for prescription drugs is similar to the elasticity of demand for health care in general. Although there are numerous studies on the elasticity of demand for prescription drugs, very few focus on the elderly population (Grootendorst et al., 1997). This group should be of particular interest because they typically have higher medical care needs and costs and their population is growing rapidly. A study undertaken in Canada by Grootendorst et al. (1997) sought to fill this gap in the literature. They used data from the Ontario Health Survey to study the effect of first-dollar prescription drug coverage on drug use by seniors. At age 65, individuals in Ontario become eligible for the Ontario Drug Benefit Plan. The study compared prescription drug use before and after the statutory date of eligibility. The study found an upward shift in prescription drug use by seniors at age 65 even after controlling for health status and other demographic factors. In addition, the results suggest that the increase in prescription drug use is driven by increases in drug volume among users rather than by increases in the probability of any use. Consistent with this result is the finding that persons with poorer reported health status are more likely to increase prescription drug use with first-dollar coverage Questions: 1. Is the demand for preventive care elastic or inelastic? Explain why. (1point). 2. What is the difference in elasticity between inpatient and outpatient care?(2 points) 3. What is the effect of an increase in drug copayments on the elasticity of drugs?(2points)Step by Step Solution
There are 3 Steps involved in it
Step: 1

Get Instant Access to Expert-Tailored Solutions
See step-by-step solutions with expert insights and AI powered tools for academic success
Step: 2

Step: 3
Ace Your Homework with AI
Get the answers you need in no time with our AI-driven, step-by-step assistance
Get Started
Personal Finance
Authors: Jack Kapoor, Les Dlabay, Robert Hughes
4th Edition
0256147175, 978-0256147179