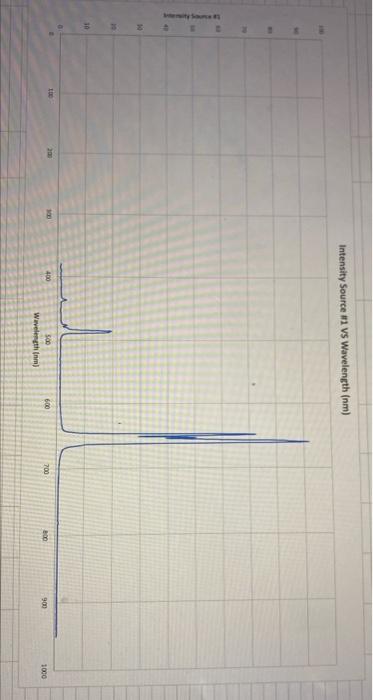
Question: please answer tgese 3 questions in detail. thank you Intensity Source #1 Vs Wavelength (nm) TE 400 600 700 50 Wavelength (m) 200 900 1000


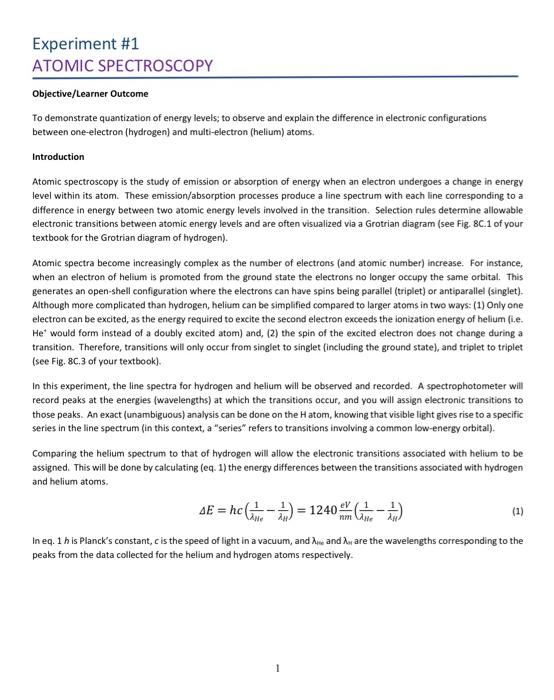
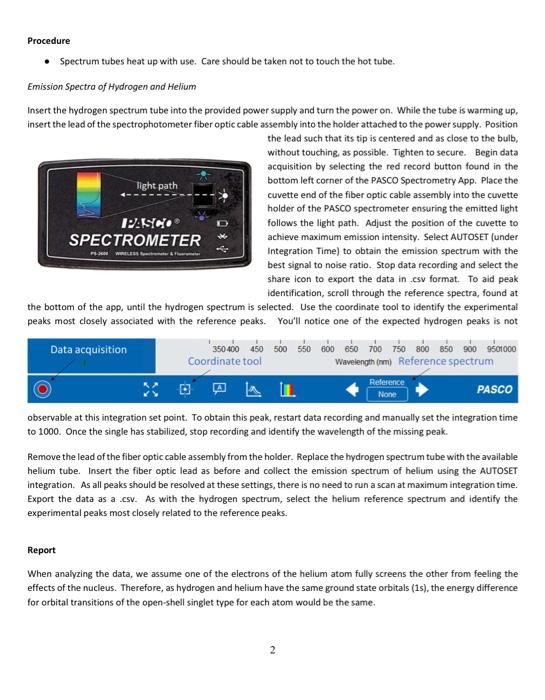
Intensity Source #1 Vs Wavelength (nm) TE 400 600 700 50 Wavelength (m) 200 900 1000 Untitled.sp 2022-01-07 11:37 Source #1 78 ms Analyze Light Integration Time Number of Scans to Average Smoothing 10 0 3) 4) What is the meaning of the negative energy differences in the spreadsheet? Are there any energy differences that are the same or almost the same in more than two columns? Identify these lines, which are the open-shell singlet lines in He (lines that have the same orbital transition as the Balmer series for H). Because there are two electrons in helium, transition to either an open-shell singlet (see (3) or a triplet energy state is possible. The triplet state is lower in energy than the open-shell singlet. Assuming the higher energy state remains at the same energy level (is this assumption valid?), determine which lines correspond to the triplet state. Remember, the higher-energy states have constant energies, so there should be a consistent energy difference between the singlet and triplet for each line. Identify the lines that belong to this series of triplet lower-energy state lines. 5) Is the energy of the transition to the triplet state larger (more energetic) or smaller? Explain. Experiment #1 ATOMIC SPECTROSCOPY Objective/Learner Outcome To demonstrate quantization of energy levels, to observe and explain the difference in electronic configurations between one-electron (hydrogen) and multi-electron (helium) atoms. Introduction Atomic spectroscopy is the study of emission or absorption of energy when an electron undergoes a change in energy level within its atom. These emission/absorption processes produce a line spectrum with each line corresponding to a difference in energy between two atomic energy levels involved in the transition. Selection rules determine allowable electronic transitions between atomic energy levels and are often visualized via a Grotrian diagram (see Fig. 8C.1 of your textbook for the Grotrian diagram of hydrogen). Atomic spectra become increasingly complex as the number of electrons (and atomic number) increase. For instance, when an electron of helium is promoted from the ground state the electrons no longer occupy the same orbital. This generates an open-shell configuration where the electrons can have spins being parallel (triplet) or antiparallel (singlet). Although more complicated than hydrogen, helium can be simplified compared to larger atoms in two ways: (1) Only one electron can be excited, as the energy required to excite the second electron exceeds the ionization energy of helium (.e. He would form instead of a doubly excited atom) and, (2) the spin of the excited electron does not change during a transition. Therefore, transitions will only occur from singlet to singlet (including the ground state), and triplet to triplet (see Fig. 8C.3 of your textbook). In this experiment, the line spectra for hydrogen and helium will be observed and recorded. A spectrophotometer will record peaks at the energies (wavelengths) at which the transitions occur, and you will assign electronic transitions to those peaks. An exact (unambiguous) analysis can be done on the Hatom, knowing that visible light gives rise to a specific series in the line spectrum (in this context, a "series refers to transitions involving a common low-energy orbital). Comparing the helium spectrum to that of hydrogen will allow the electronic transitions associated with helium to be assigned. This will be done by calculating (eq. 1) the energy differences between the transitions associated with hydrogen and helium atoms. SE = hc Cite ) = 1240 GO W (1) In eq. 1 his Planck's constant, cis the speed of light in a vacuum, and he and are the wavelengths corresponding to the peaks from the data collected for the helium and hydrogen atoms respectively. = AN 1 Procedure Spectrum tubes heat up with use. Care should be taken not to touch the hot tube. Emission Spectra of Hydrogen and Helium Insert the hydrogen spectrum tube into the provided power supply and turn the power on. While the tube is warming up, insert the head of the spectrophotometer fiber optic cable assembly into the holder attached to the power supply. Position the lead such that its tip is centered and as close to the bulb, without touching, as possible. Tighten to secure. Begin data acquisition by selecting the red record button found in the Tight path bottom left corner of the PASCO Spectrometry App. Place the cuvette end of the fiber optic cable assembly into the cuvette holder of the PASCO spectrometer ensuring the emitted light PPISCO follows the light path. Adjust the position of the cuvette to SPECTROMETER achieve maximum emission intensity. Select AUTOSET (under Integration Time) to obtain the emission spectrum with the best signal to noise ratio. Stop data recording and select the share icon to export the data in .csv format. To aid peak identification, scroll through the reference spectra, found at the bottom of the app, until the hydrogen spectrum is selected. Use the coordinate tool to identify the experimental peaks most closely associated with the reference peaks. You'll notice one of the expected hydrogen peaks is not Data acquisition 350 400 450 500 550 60 850 700 750 800 850 900 9501000 Coordinate tool Wavelength (mm) Reference spectrum Reference None PASCO observable at this integration set point. To obtain this peak, restart data recording and manually set the integration time to 1000. Once the single has stabilized, stop recording and identify the wavelength of the missing peak. Remove the lead of the fiber optic cable assembly from the holder. Replace the hydrogen spectrum tube with the available helium tube. Insert the fiber optic lead as before and collect the emission spectrum of helium using the AUTOSET integration. As all peaks should be resolved at these settings, there is no need to run a scan at maximum integration time. Export the data as a .csv. As with the hydrogen spectrum, select the helium reference spectrum and identify the experimental peaks most closely related to the reference peaks. Report When analyzing the data, we assume one of the electrons of the hellium atom fully screens the other from feeling the effects of the nucleus. Therefore, as hydrogen and helium have the same ground state orbitals (is), the energy difference for orbital transitions of the open-shell singlet type for each atom would be the same. 2
Step by Step Solution
There are 3 Steps involved in it

Get step-by-step solutions from verified subject matter experts


