Answered step by step
Verified Expert Solution
Question
1 Approved Answer
please answer the 5 questions at the bottom of the paper. Financial ratio data is listed below for Gallery of Dreams. Construct a list of
please answer the 5 questions at the bottom of the paper.
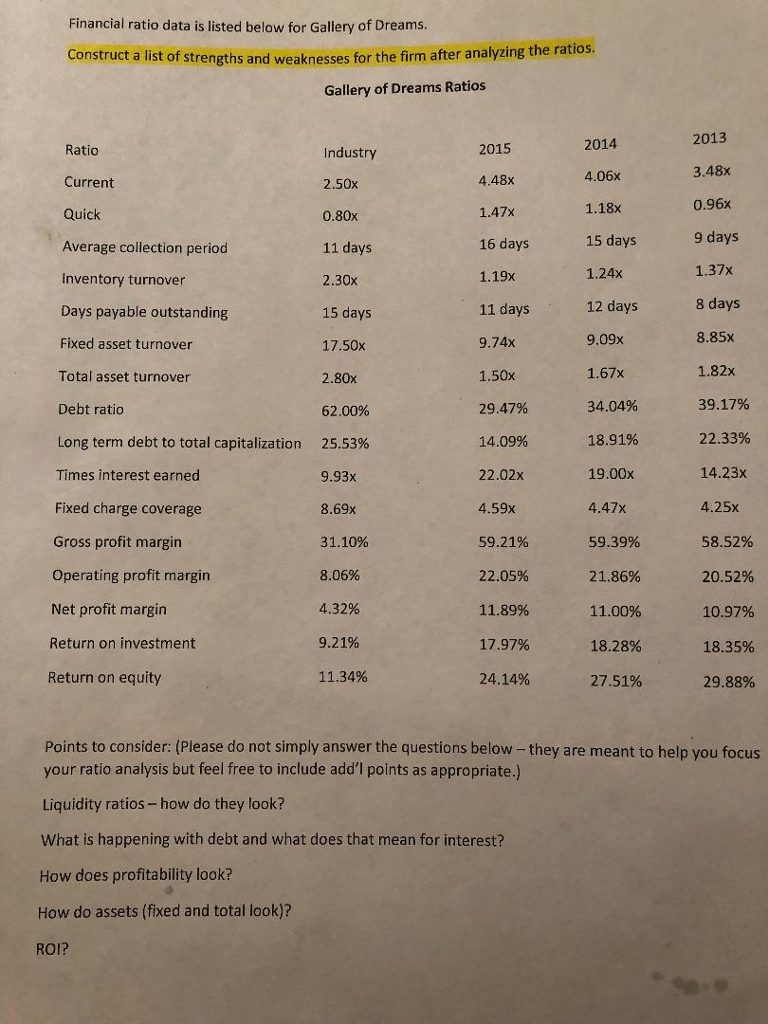
Financial ratio data is listed below for Gallery of Dreams. Construct a list of strengths and weaknesses for the firm after analyzing the ra tios. Gallery of Dreams Ratios 2013 2014 4.06x 1.18x 15 days 1.24x 12 days 9.09x 1.67x 34.04% 18.91% 19.00x 4.47x 59.39% 21.86% 11 .00% 18.28% 27.51% Ratio Industry 2.50x 0.80x 11 days 2.30x 15 days 17.50x 2.80x 62.00% 25.53% 9.93x 8.69x 31.10% 8.06% 4.32% 9.21% 11.34% 2015 4.48x 1.47x 16 days 1.19x 11 days 9.74x 1.50x 29.47% 14.09% 22.02x 4.59x 59.21% 22.05% 11.89% 17.97% 24.14% 3.48x Current 0.96x Quick Average collection period Inventory turnover Days payable outstanding Fixed asset turnover Total asset turnover Debt ratio Long term debt to total capitalization Times interest earned Fixed charge coverage Gross profit margin Operating profit margin Net profit margin 9 days 1.37x 8 days 8.85x 1.82x 39.17% 22.33% 14.23x 4.25x 58.52% 20.52% 10.97% 18.35% 29.88% Return on investment Return on equity Points to consider: (Please do not simply answer the questions below- they are meant to help you focus your ratio analysis but feel free to include add'l points as appropriate.) Liquidity ratios-how do they look? What is happening with debt and what does that mean for interest? How does profitability look? How do assets (fixed and total look)? ROIStep by Step Solution
There are 3 Steps involved in it
Step: 1
Get Instant Access to Expert-Tailored Solutions
See step-by-step solutions with expert insights and AI powered tools for academic success
Step: 2
Step: 3
Ace Your Homework with AI
Get the answers you need in no time with our AI-driven, step-by-step assistance
Get Started