Answered step by step
Verified Expert Solution
Link Copied!

Question

1 Approved Answer

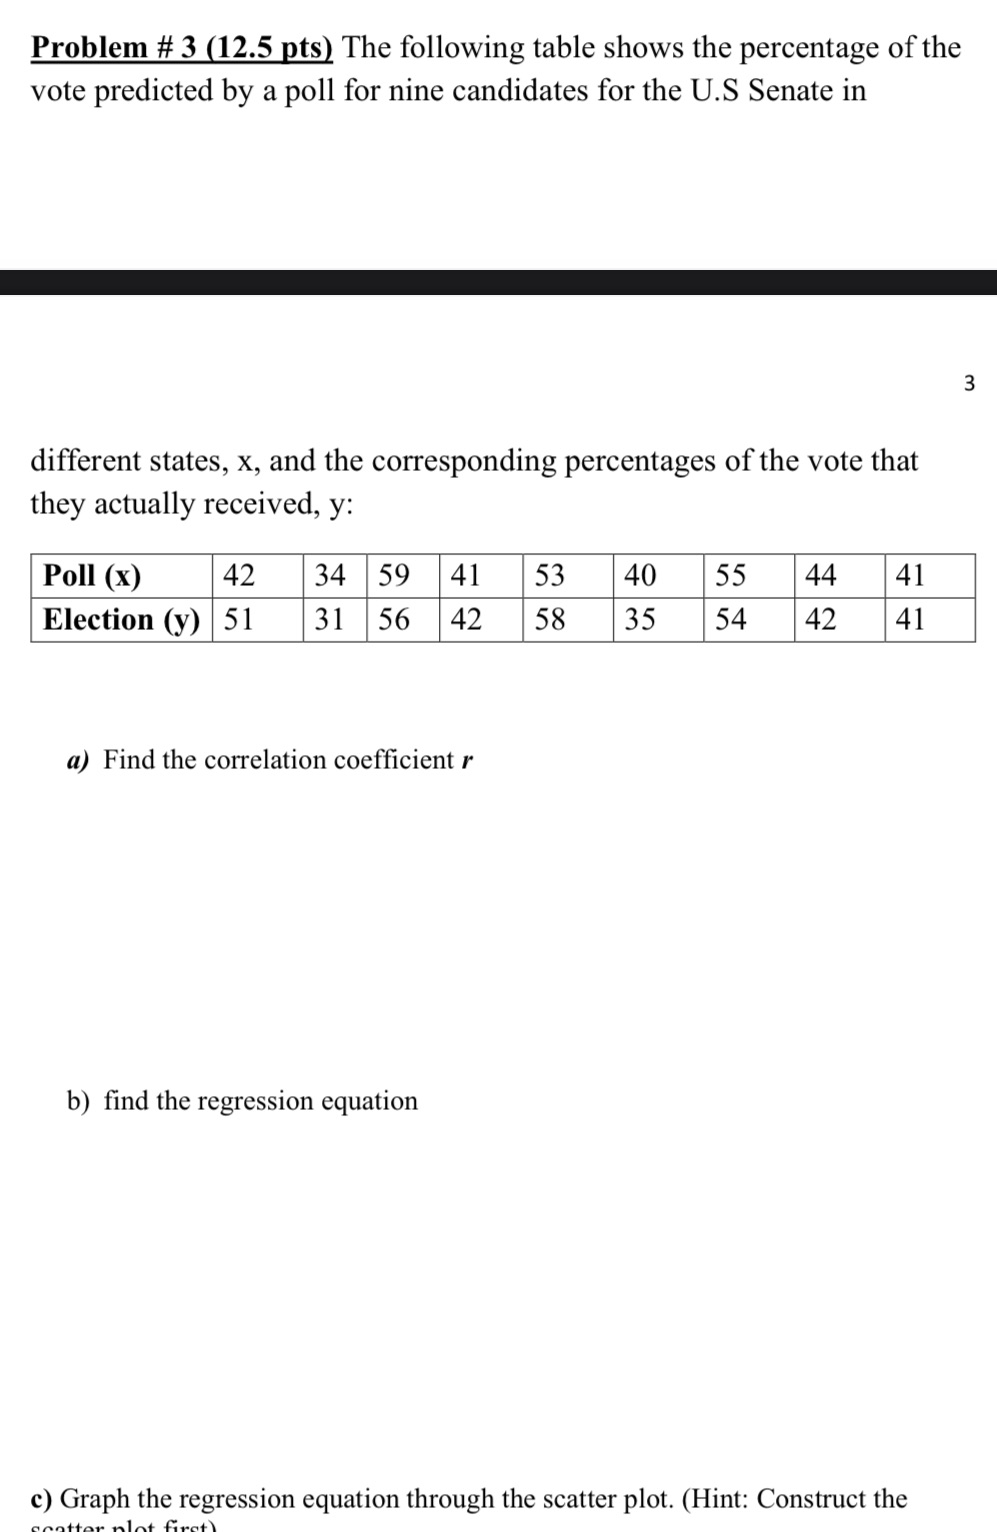
Please answer the a b and c please Problem # 3 (12.5 pts) The following table shows the percentage of the vote predicted by a

Please answer the a b and c please

image text in transcribed
Problem # 3 (12.5 pts) The following table shows the percentage of the vote predicted by a poll for nine candidates for the U.S Senate in 3 different states, x, and the corresponding percentages of the vote that they actually received, y: Poll (x) 42 34 59 41 53 40 55 44 41 Election (y) 51 31 56 42 58 35 54 42 41 a) Find the correlation coefficient r b) find the regression equation c) Graph the regression equation through the scatter plot. (Hint: Construct the

Step by Step Solution

There are 3 Steps involved in it

Step: 1

blur-text-image

Get Instant Access to Expert-Tailored Solutions

See step-by-step solutions with expert insights and AI powered tools for academic success

Step: 2

blur-text-image

Step: 3

blur-text-image

Ace Your Homework with AI

Get the answers you need in no time with our AI-driven, step-by-step assistance

Get Started

Recommended Textbook for

Intermediate Algebra

Authors: Marvin L Bittinger

11th Edition

0321968395, 9780321968395

More Books

Students also viewed these Mathematics questions

Question

1. Define the nature of interviews

Answered: 1 week ago

Question

2. Outline the different types of interviews

Answered: 1 week ago