

Answered step by step
Verified Expert Solution
Question
1 Approved Answer
PLease answer the do this part of the asignment the bottom images are needed to answer. DO THIS: Multiply the square points matrix ( spm)

PLease answer the do this part of the asignment the bottom images are needed to answer.
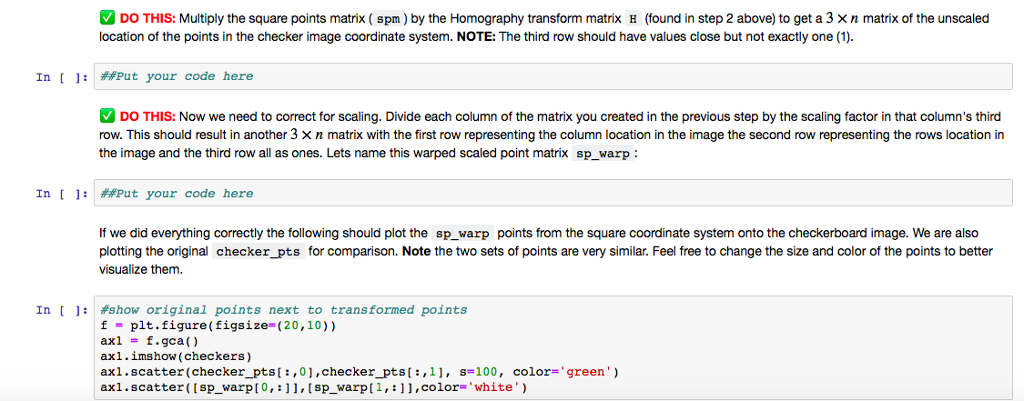
DO THIS: Multiply the square points matrix ( spm) by the Homography transform matrix H (found in step 2 above) to get a 3 n matrix of the unscaled location of the points in the checker image coordinate system. NOTE: The third row should have values close but not exactly one (1) In : Put your code here DO THIS: Now we need to correct for scaling. Divide each column of the matrix you created in the previous step by the scaling factor in that column's third row his should result in another 3 n matrix with he first row representin the column ocation in he image the second row representing the rows ocation n the image and the third row all as ones. Lets name this warped scaled point matrix sp_warp In :Put your code here If we did everything correctly the following should plot the sp_warp points from the square coordinate system onto the checkerboard image. We are also plotting the original checker_pts for comparison. Note the two sets of points are very similar. Feel free to change the size and color of the points to better visualize them. In [ ]: #show original points next to transformed points f- pit.figure(figsize-(20,10)) axlf.gca() axl.imshow (checkers) axl.scatter (checker_ptst:,0],checker_ptsl:,11, s-100, color-'green axi . scatter ( [ sp-warp [ 0, : ] ] , [ sp-warp [ 1,), color-white' ) DO THIS: Multiply the square points matrix ( spm) by the Homography transform matrix H (found in step 2 above) to get a 3 n matrix of the unscaled location of the points in the checker image coordinate system. NOTE: The third row should have values close but not exactly one (1) In : Put your code here DO THIS: Now we need to correct for scaling. Divide each column of the matrix you created in the previous step by the scaling factor in that column's third row his should result in another 3 n matrix with he first row representin the column ocation in he image the second row representing the rows ocation n the image and the third row all as ones. Lets name this warped scaled point matrix sp_warp In :Put your code here If we did everything correctly the following should plot the sp_warp points from the square coordinate system onto the checkerboard image. We are also plotting the original checker_pts for comparison. Note the two sets of points are very similar. Feel free to change the size and color of the points to better visualize them. In [ ]: #show original points next to transformed points f- pit.figure(figsize-(20,10)) axlf.gca() axl.imshow (checkers) axl.scatter (checker_ptst:,0],checker_ptsl:,11, s-100, color-'green axi . scatter ( [ sp-warp [ 0, : ] ] , [ sp-warp [ 1,), color-white' )Step by Step Solution
There are 3 Steps involved in it
Step: 1

Get Instant Access to Expert-Tailored Solutions
See step-by-step solutions with expert insights and AI powered tools for academic success
Step: 2

Step: 3
Ace Your Homework with AI
Get the answers you need in no time with our AI-driven, step-by-step assistance
Get Started
Oracle Databases On The Web Learn To Create Web Pages That Interface With Database Engines
Authors: Robert Papaj, Donald Burleson
11th Edition
1576100995, 978-1576100998