please answer the following biology questions using the chart: fsummarized data. Use the Figure Rubric, posted on D2L, as a guide. Submit your figure with
please answer the following biology questions using the chart:
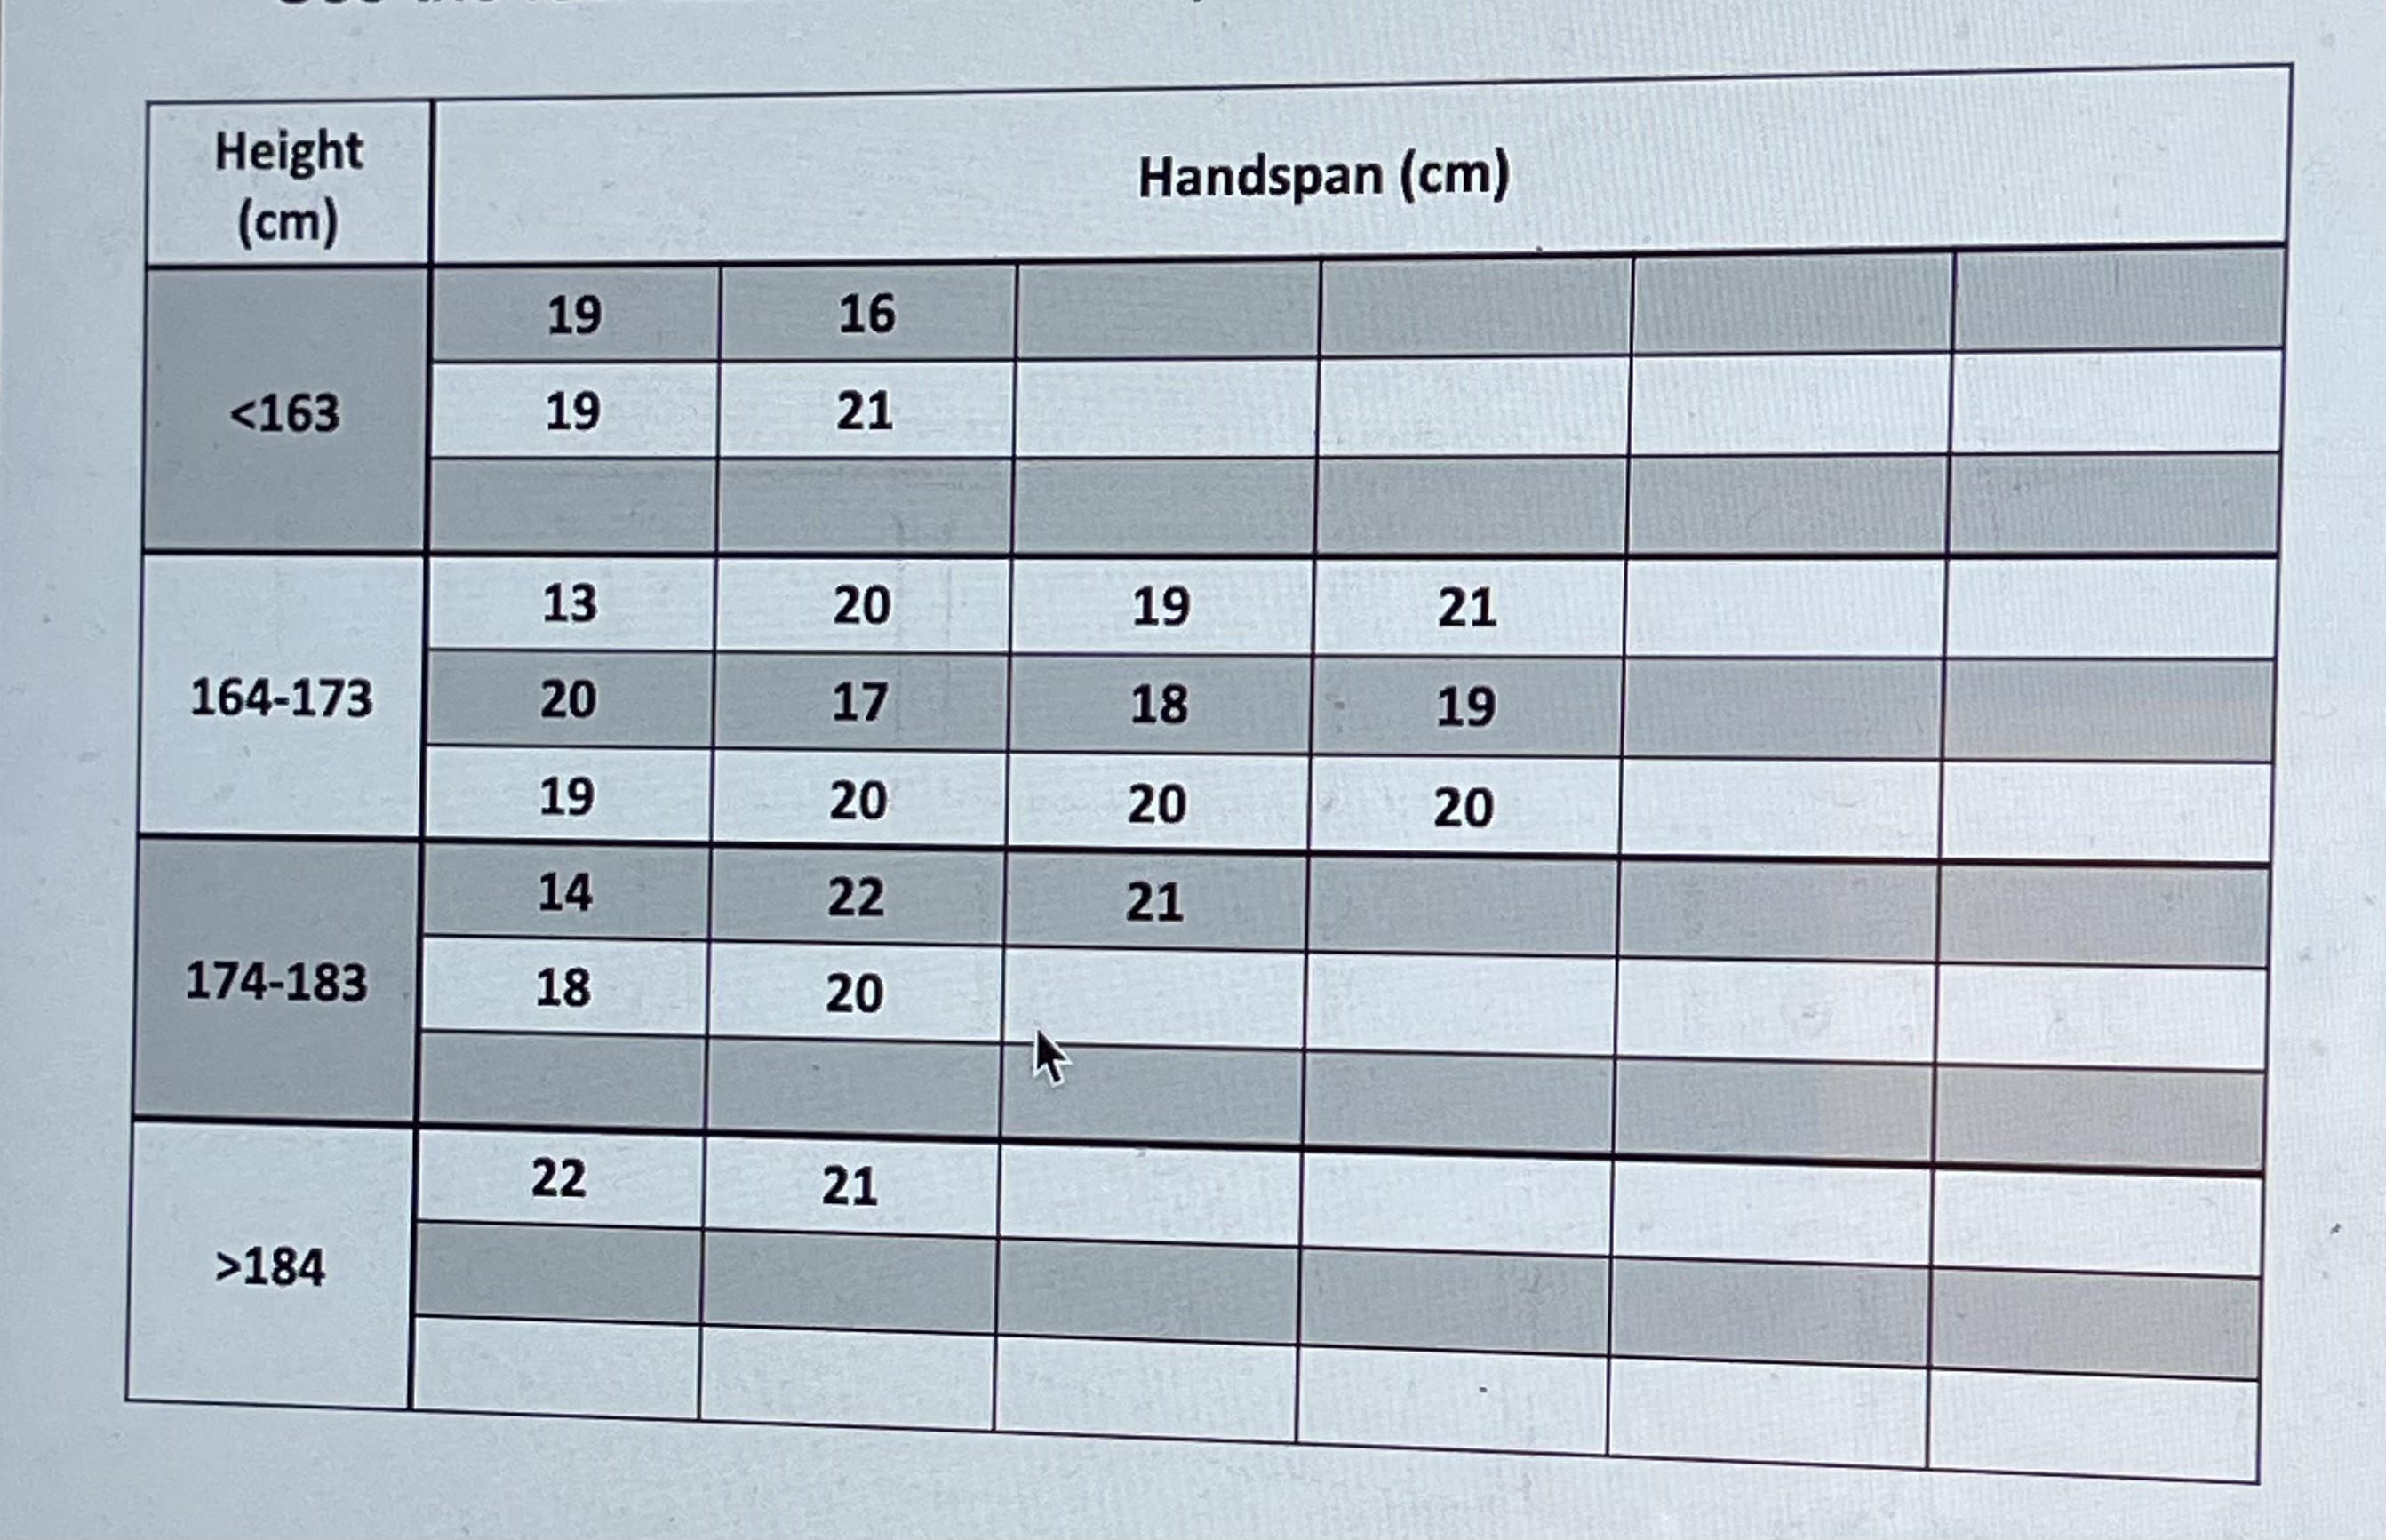
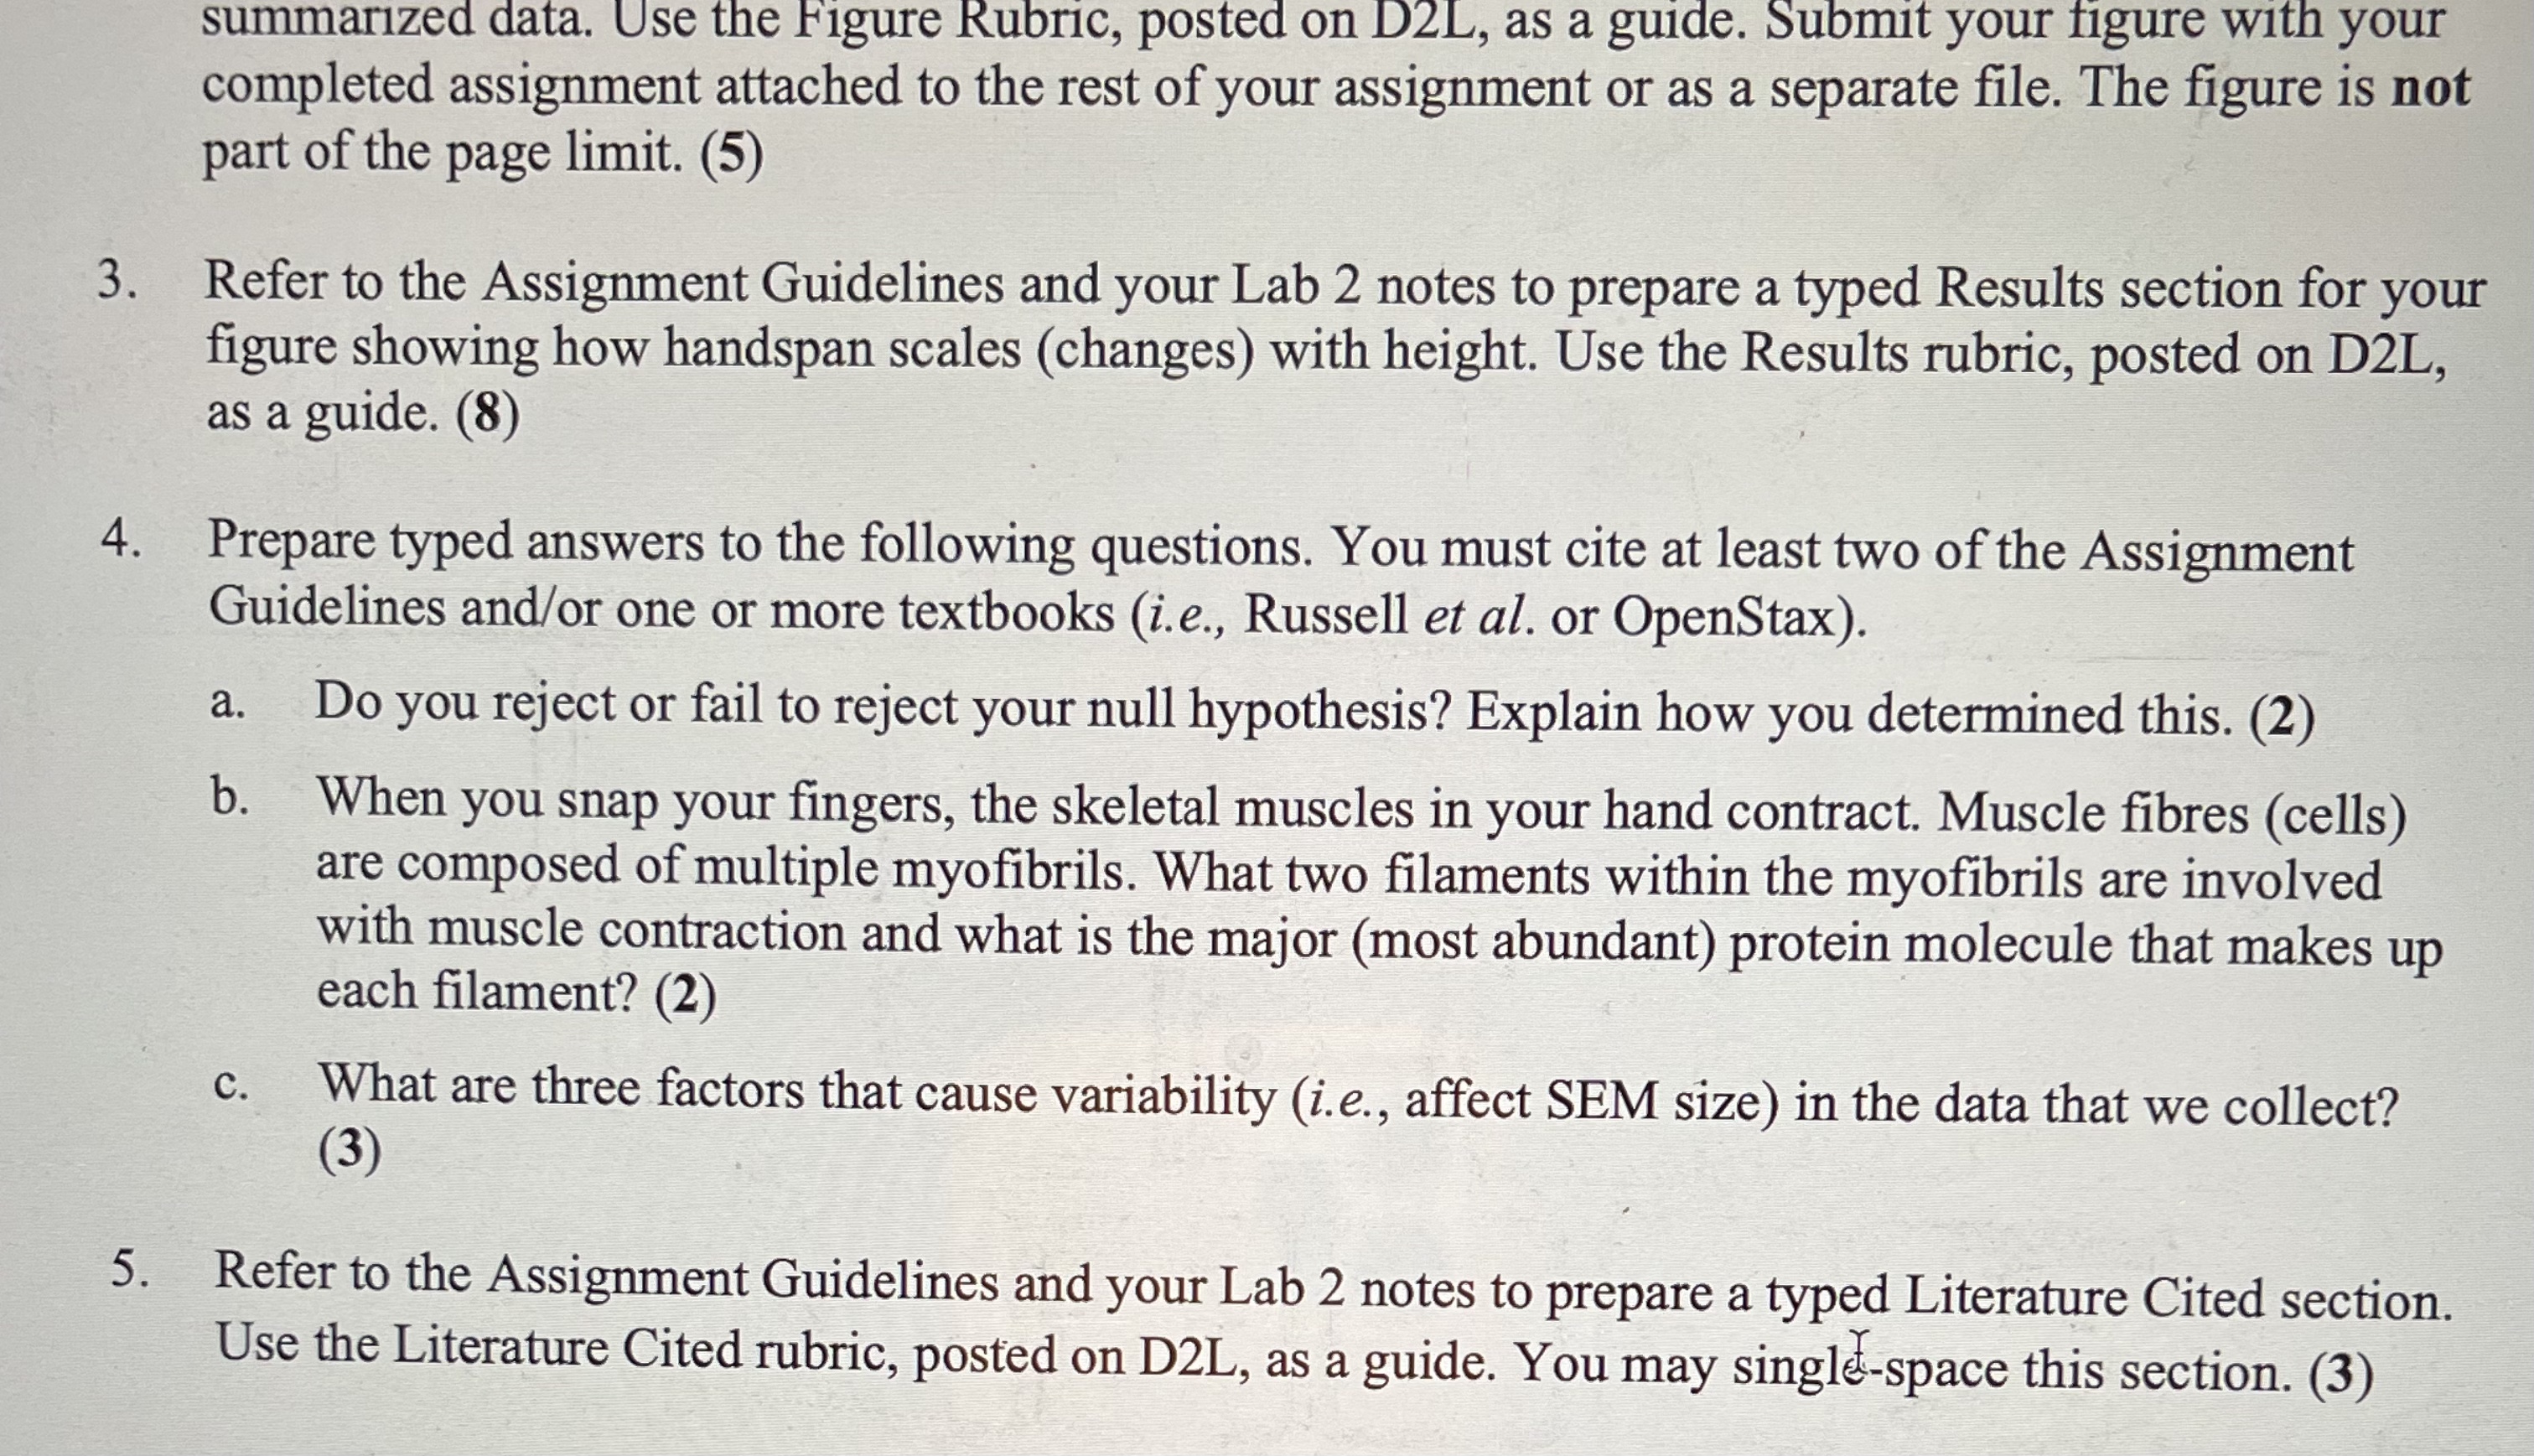
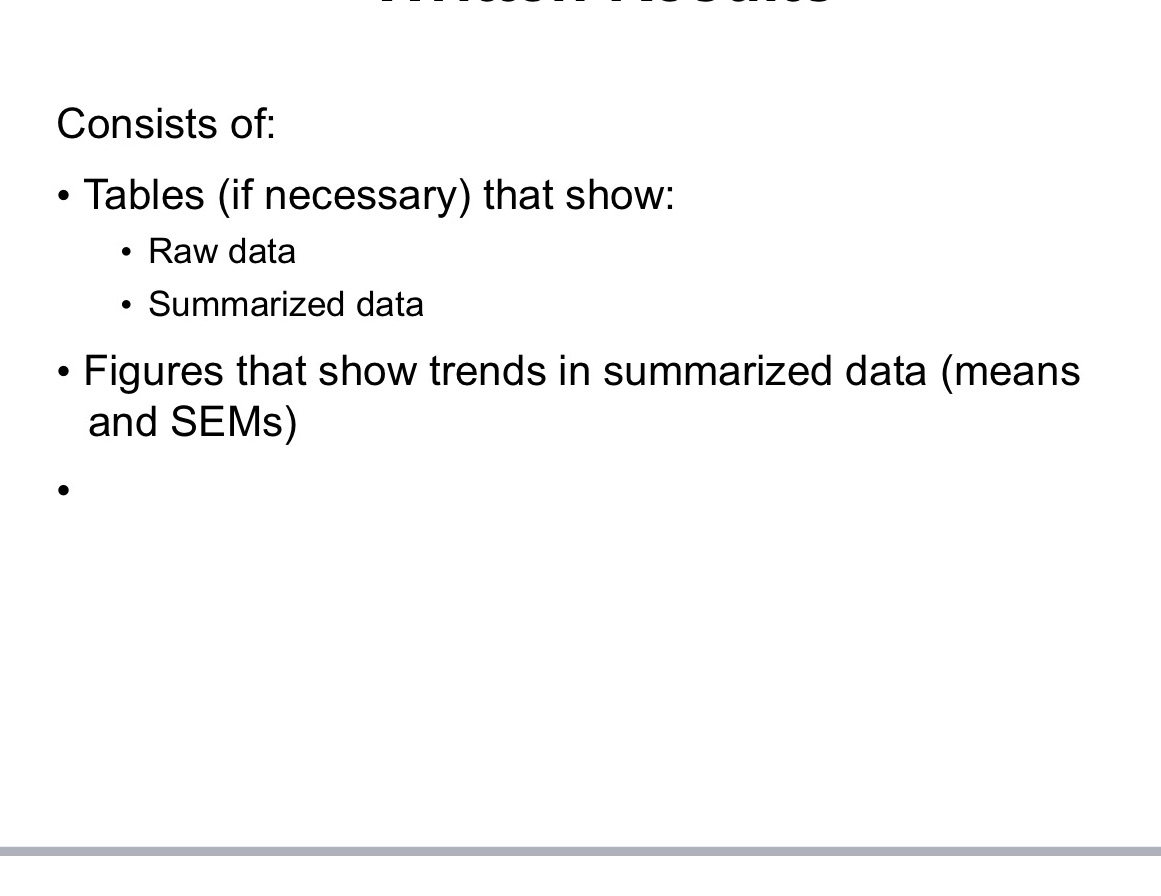
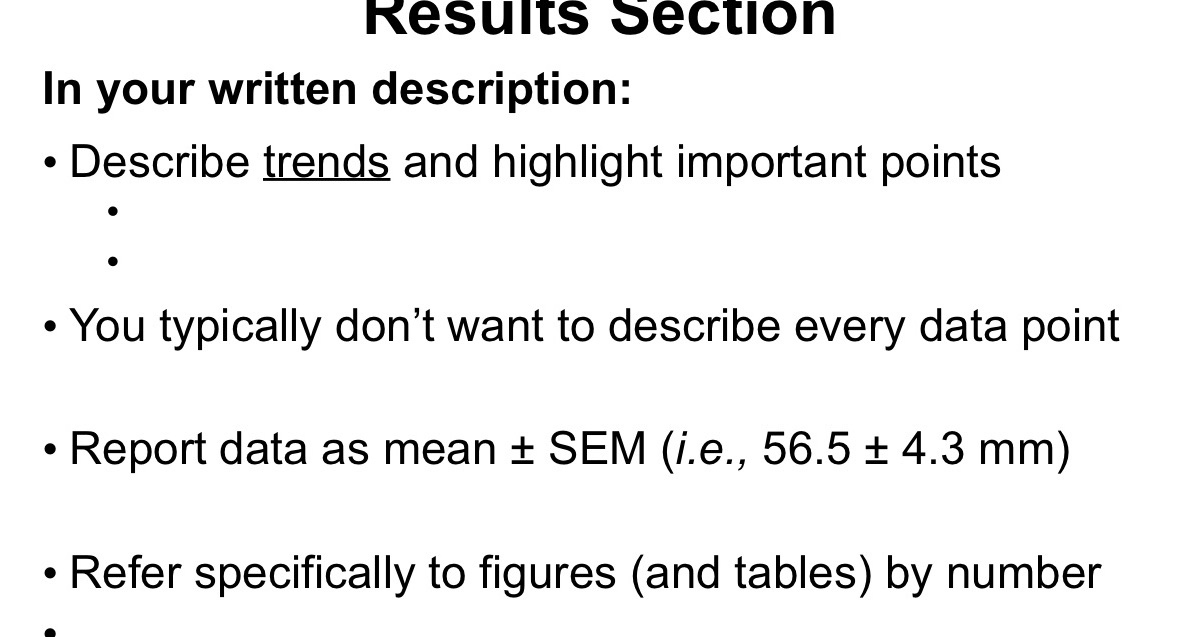
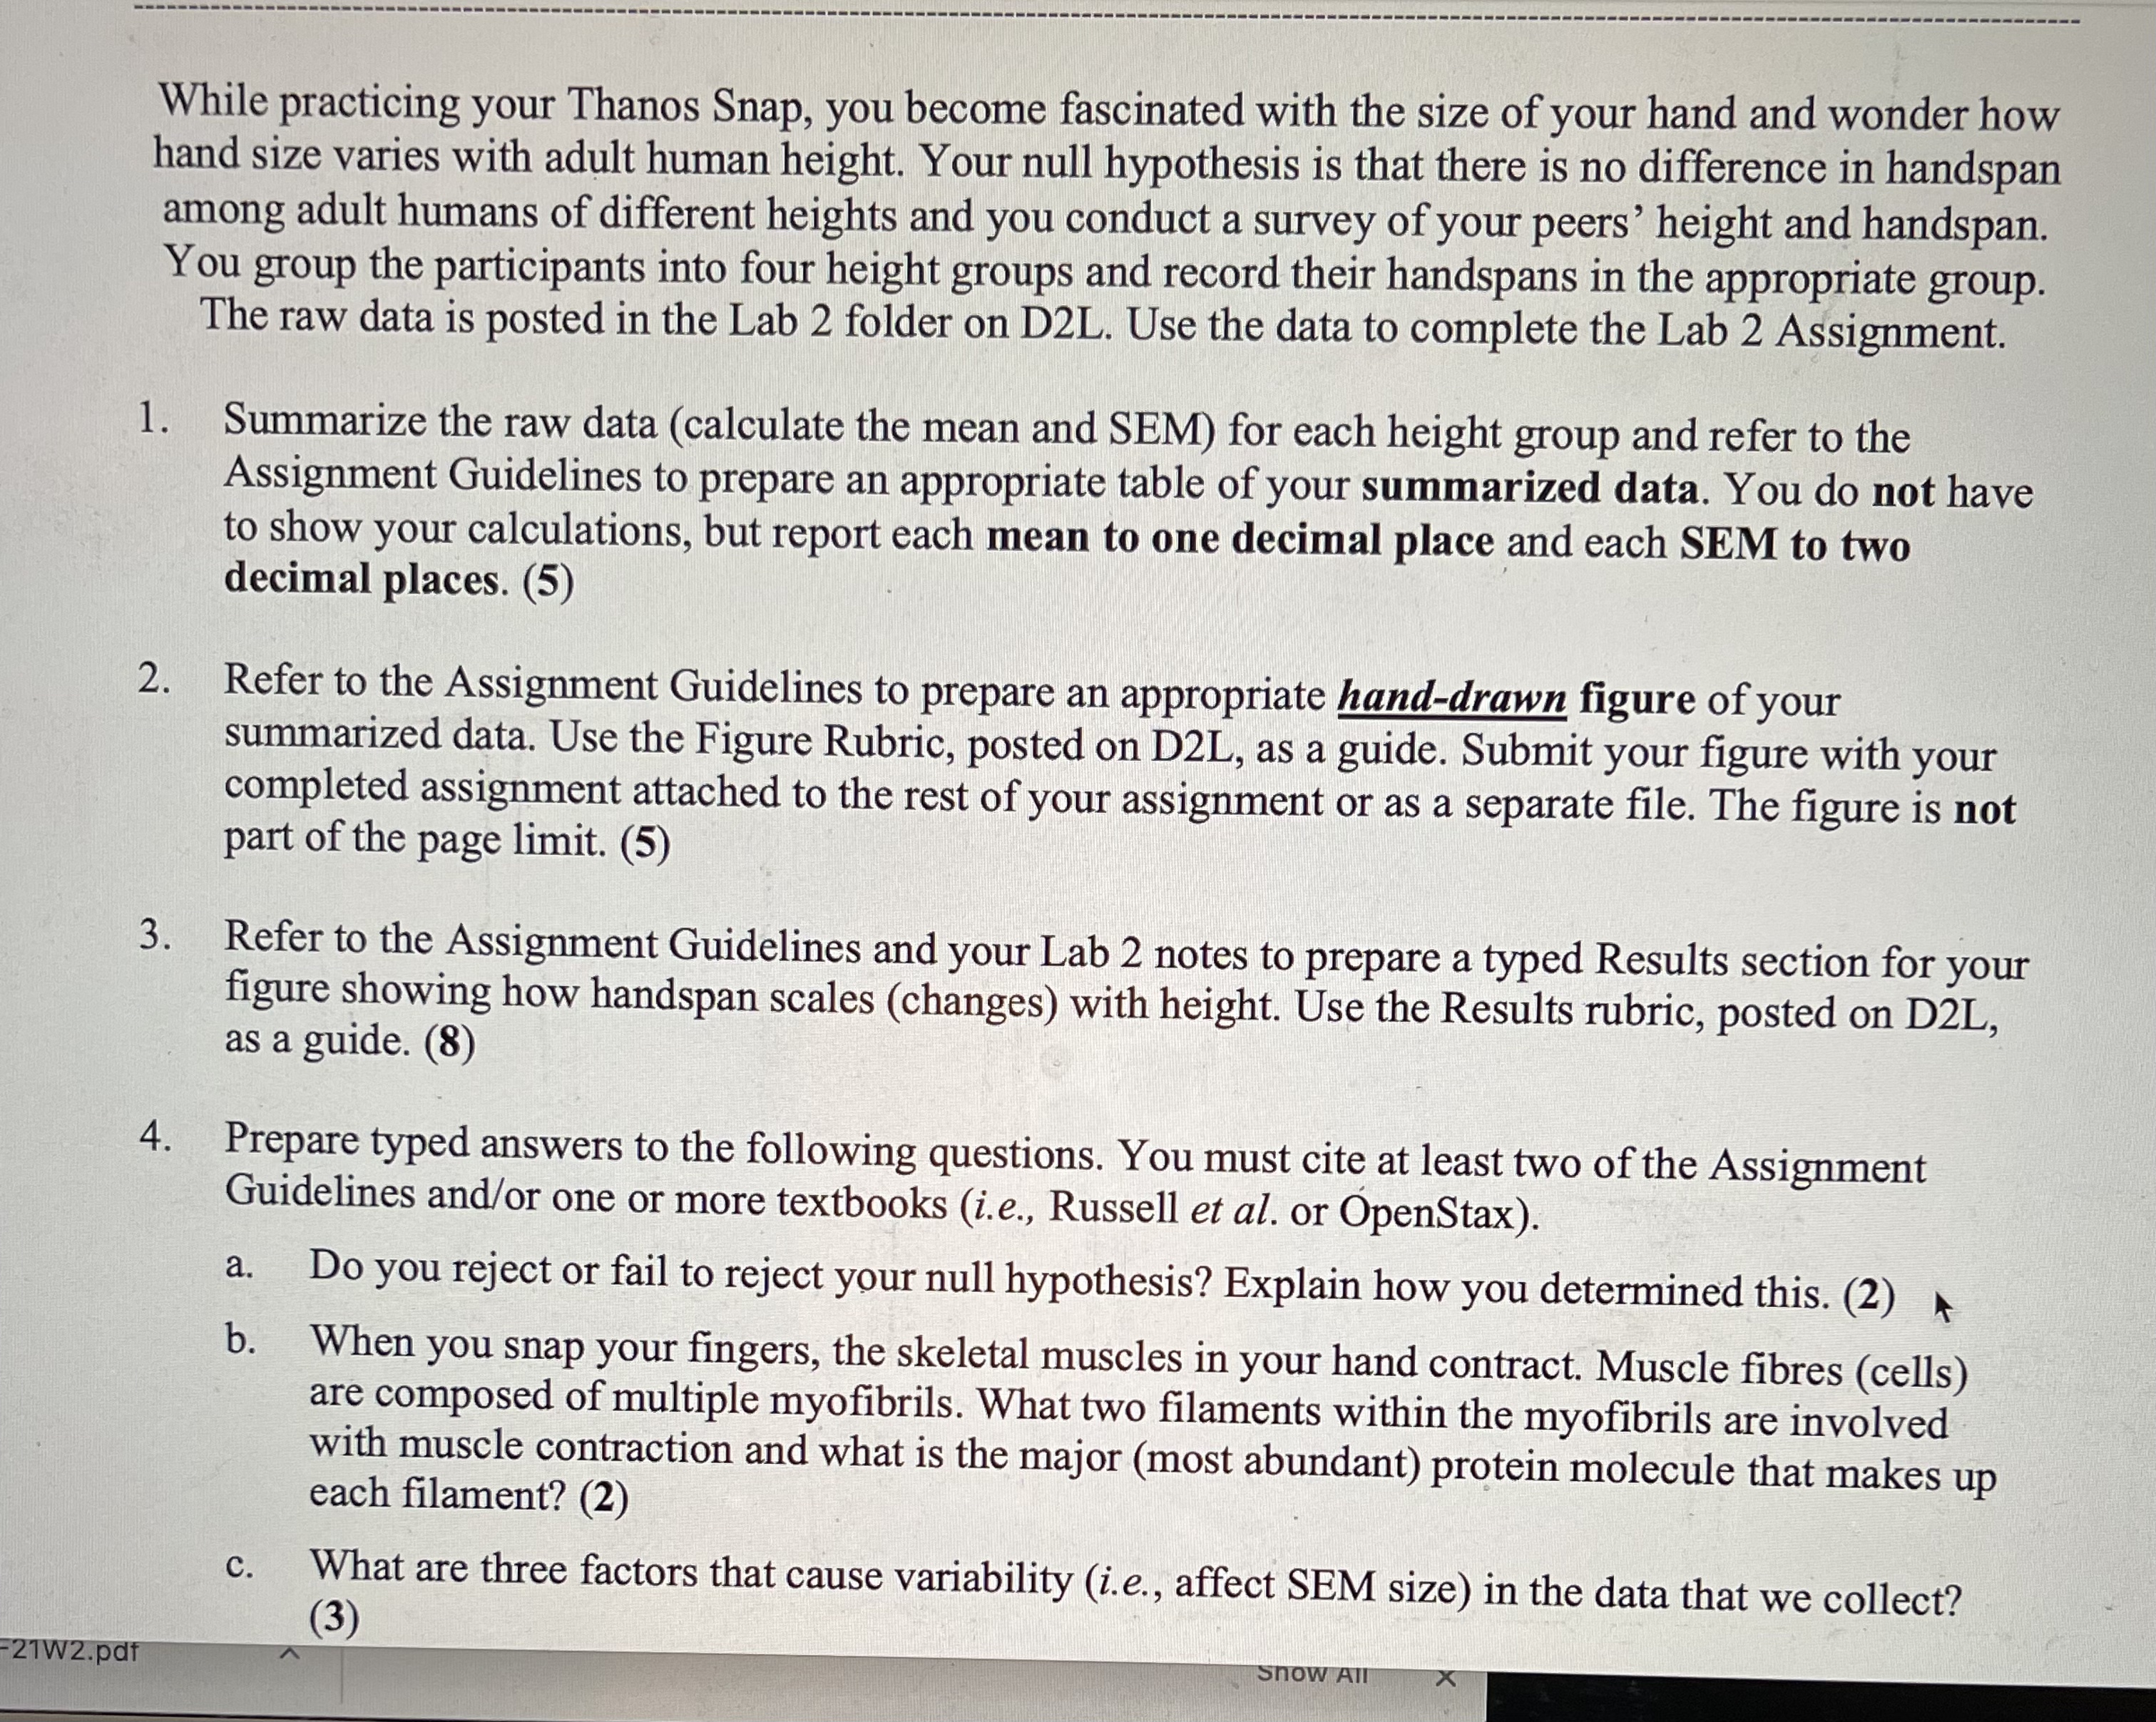
\fsummarized data. Use the Figure Rubric, posted on D2L, as a guide. Submit your figure with your completed assignment attached to the rest of your assignment or as a separate file. The figure is not part of the page limit. (5) 3. Refer to the Assignment Guidelines and your Lab 2 notes to prepare a typed Results section for your figure showing how handspan scales (changes) with height. Use the Results rubric, posted on D2L, as a guide. (8) 4. Prepare typed answers to the following questions. You must cite at least two of the Assignment Guidelines and/or one or more textbooks (i.e., Russell et al. or OpenStax). a. Do you reject or fail to reject your null hypothesis? Explain how you determined this. (2) b. When you snap your fingers, the skeletal muscles in your hand contract. Muscle fibres (cells) are composed of multiple myofibrils. What two filaments within the myofibrils are involved with muscle contraction and what is the major (most abundant) protein molecule that makes up each filament? (2) c. What are three factors that cause variability (i.e., affect SEM size) in the data that we collect? (3 5. Refer to the Assignment Guidelines and your Lab 2 notes to prepare a typed Literature Cited section. Use the Literature Cited rubric, posted on D2L, as a guide. You may single-space this section. (3)Consists of: - Tables (if necessary) that show: . Raw data . Summarized data - Figures that show trends in summarized data (means and SEMs) Results Section In your written description: . Describe trends and highlight important points . You typically don't want to describe every data point . Report data as mean + SEM (i.e., 56.5 + 4.3 mm) . Refer specifically to figures (and tables) by numberWhile practicing your Thanos Snap, you become fascinated with the size of your hand and wonder how hand size varies with adult human height. Your null hypothesis is that there is no difference in handspan among adult humans of different heights and you conduct a survey of your peers' height and handspan. You group the participants into four height groups and record their handspans in the appropriate group. The raw data is posted in the Lab 2 folder on D2L. Use the data to complete the Lab 2 Assignment. 1. Summarize the raw data (calculate the mean and SEM) for each height group and refer to the Assignment Guidelines to prepare an appropriate table of your summarized data. You do not have to show your calculations, but report each mean to one decimal place and each SEM to two decimal places. (5) 2. Refer to the Assignment Guidelines to prepare an appropriate hand-drawn figure of your summarized data. Use the Figure Rubric, posted on D2L, as a guide. Submit your figure with your completed assignment attached to the rest of your assignment or as a separate file. The figure is not part of the page limit. (5) 3. Refer to the Assignment Guidelines and your Lab 2 notes to prepare a typed Results section for your figure showing how handspan scales (changes) with height. Use the Results rubric, posted on D2L, as a guide. (8) 4. Prepare typed answers to the following questions. You must cite at least two of the Assignment Guidelines and/or one or more textbooks (i.e., Russell et al. or OpenStax). a. Do you reject or fail to reject your null hypothesis? Explain how you determined this. (2) b. When you snap your fingers, the skeletal muscles in your hand contract. Muscle fibres (cells) are composed of multiple myofibrils. What two filaments within the myofibrils are involved with muscle contraction and what is the major (most abundant) protein molecule that makes up each filament? (2) C. What are three factors that cause variability (i.e., affect SEM size) in the data that we collect? (3 21W2.pdf
Step by Step Solution
There are 3 Steps involved in it
Step: 1
Get Instant Access to Expert-Tailored Solutions
See step-by-step solutions with expert insights and AI powered tools for academic success
Step: 2
Step: 3
Ace Your Homework with AI
Get the answers you need in no time with our AI-driven, step-by-step assistance