Please answer the following Question:
| Using the following information please asses Chinchilla Corporation's liquidity position. Calculate whatever ratios that you think are relevant to the discussion and in you assessment be sure to: |
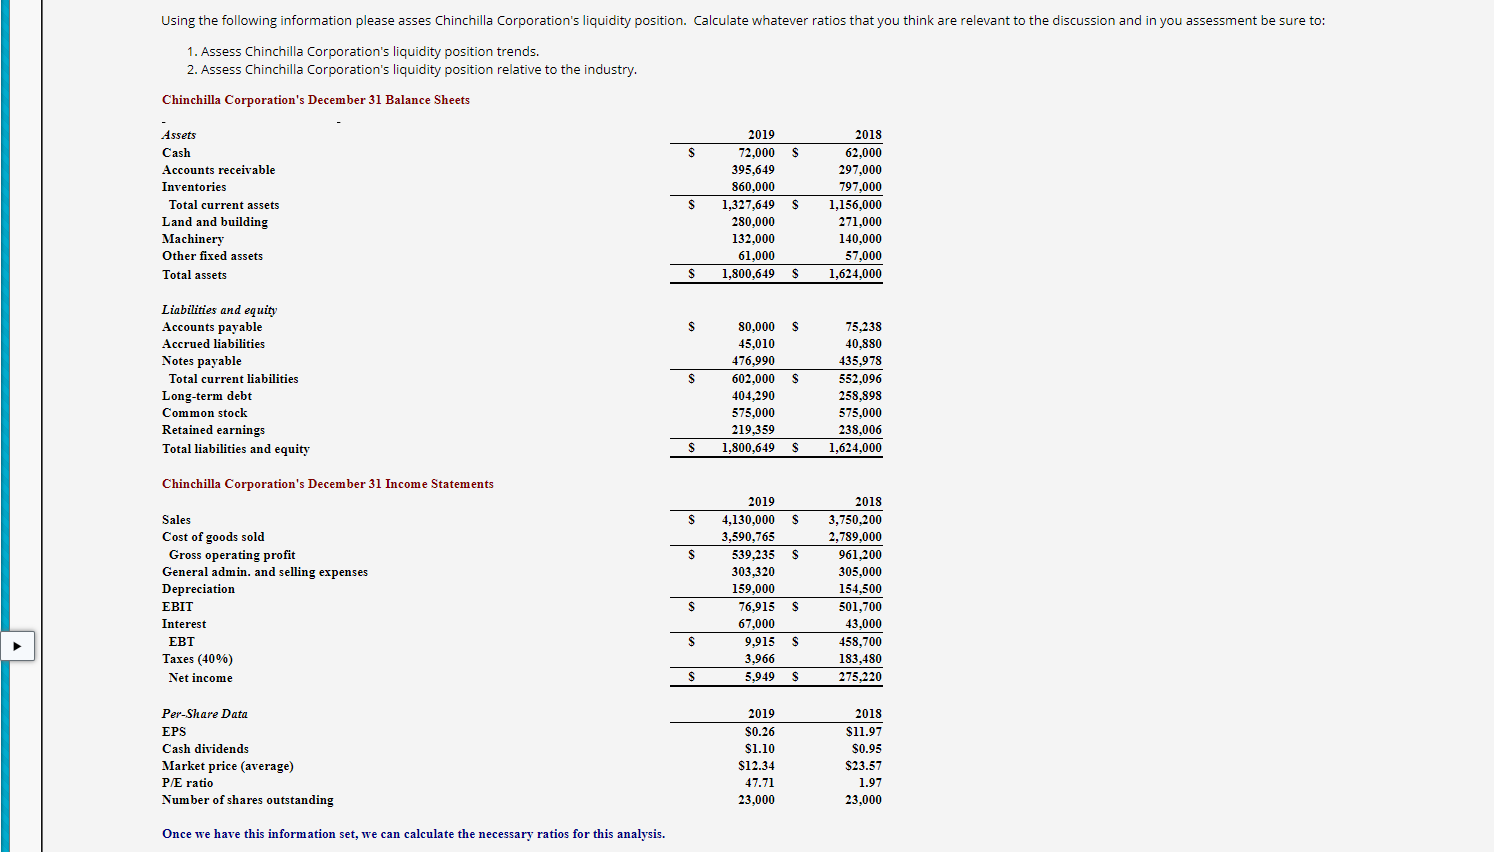
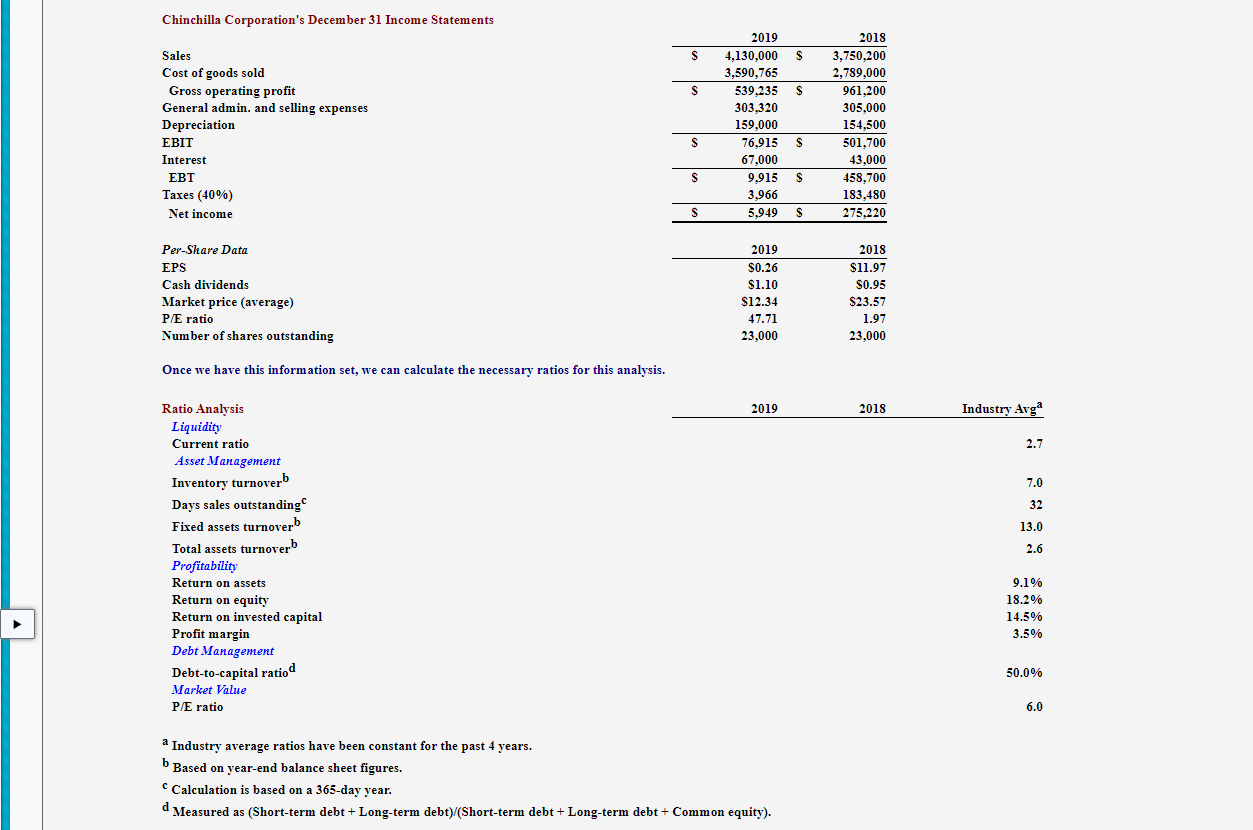
Using the following information please asses Chinchilla Corporation's liquidity position. Calculate whatever ratios that you think are relevant to the discussion and in you assessment be sure to: 1. Assess Chinchilla Corporation's liquidity position trends. 2. Assess Chinchilla Corporation's liquidity position relative to the industry. Chinchilla Corporation's December 31 Balance Sheets 2018 62,000 S 297.000 Assets Cash Accounts receivable Inventories Total current assets Land and building Machinery Other fixed assets Total assets S 2019 72,000 $ 395,649 860.000 1,327,649 $ 280,000 132,000 61,000 1,800,649 $ 797,000 1,156,000 271.000 140,000 57,000 1,624.000 S S S Liabilities and equity Accounts payable Accrued liabilities Notes payable Total current liabilities Long-term debt Common stock Retained earnings Total liabilities and equity S S 80,000 45,010 476,990 602,000 404.290 575,000 219,359 1,800,649 75,238 40.880 435,978 552,096 258.898 575,000 238.006 1.624,000 S S Chinchilla Corporation's December 31 Income Statements S S S S Sales Cost of goods sold Gross operating profit General admin. and selling expenses Depreciation EBIT Interest EBT Taxes (40%) Net income 2019 4,130,000 3,590,765 539,235 303,320 159,000 76,915 67,000 9,915 3,966 5.949 2018 3,750,200 2,789,000 961.200 305,000 154,500 501,700 43,000 458,700 183,480 275,220 S S S S S $ Per-Share Data EPS Cash dividends Market price (average) P/E ratio Number of shares outstanding 2019 $0.26 $1.10 $12.34 47.71 23,000 2018 $11.97 $0.95 $23.57 1.97 23,000 Once we have this information set, we can calculate the necessary ratios for this analysis. Chinchilla Corporation's December 31 Income Statements S $ S S Sales Cost of goods sold Gross operating profit General admin. and selling expenses Depreciation EBIT Interest EBT Taxes (40%) Net income 2019 4,130,000 3,590,765 539,235 303,320 159,000 76,915 67,000 9,915 3,966 5.949 2018 3,750,200 2,789,000 961,200 305,000 154,500 501,700 43,000 458,700 183,480 275,220 S S S S S S Per-Share Data EPS Cash dividends Market price (average) P/E ratio Number of shares outstanding 2019 $0.26 $1.10 $12.34 47.71 23,000 2018 $11.97 $0.95 $23.57 1.97 23,000 Once we have this information set, we can calculate the necessary ratios for this analysis. 2019 2018 Industry Avga 2.7 7.0 32 13.0 2.6 Ratio Analysis Liquidity Current ratio Asset Management Inventory turnoverb Days sales outstanding Fixed assets turnoverb Total assets turnoverb Profitability Return on assets Return on equity Return on invested capital Profit margin Debt Management Debt-to-capital ratiod Market Value P/E ratio 9.1% 18.2% 14.5% 3.5% 50.0% 6.0 a Industry average ratios have been constant for the past 4 years. b Based on year-end balance sheet figures. Calculation is based on a 365-day year. d Measured as (Short-term debt +Long-term debt)/(Short-term debt +Long-term debt + Common equity). Using the following information please asses Chinchilla Corporation's liquidity position. Calculate whatever ratios that you think are relevant to the discussion and in you assessment be sure to: 1. Assess Chinchilla Corporation's liquidity position trends. 2. Assess Chinchilla Corporation's liquidity position relative to the industry. Chinchilla Corporation's December 31 Balance Sheets 2018 62,000 S 297.000 Assets Cash Accounts receivable Inventories Total current assets Land and building Machinery Other fixed assets Total assets S 2019 72,000 $ 395,649 860.000 1,327,649 $ 280,000 132,000 61,000 1,800,649 $ 797,000 1,156,000 271.000 140,000 57,000 1,624.000 S S S Liabilities and equity Accounts payable Accrued liabilities Notes payable Total current liabilities Long-term debt Common stock Retained earnings Total liabilities and equity S S 80,000 45,010 476,990 602,000 404.290 575,000 219,359 1,800,649 75,238 40.880 435,978 552,096 258.898 575,000 238.006 1.624,000 S S Chinchilla Corporation's December 31 Income Statements S S S S Sales Cost of goods sold Gross operating profit General admin. and selling expenses Depreciation EBIT Interest EBT Taxes (40%) Net income 2019 4,130,000 3,590,765 539,235 303,320 159,000 76,915 67,000 9,915 3,966 5.949 2018 3,750,200 2,789,000 961.200 305,000 154,500 501,700 43,000 458,700 183,480 275,220 S S S S S $ Per-Share Data EPS Cash dividends Market price (average) P/E ratio Number of shares outstanding 2019 $0.26 $1.10 $12.34 47.71 23,000 2018 $11.97 $0.95 $23.57 1.97 23,000 Once we have this information set, we can calculate the necessary ratios for this analysis. Chinchilla Corporation's December 31 Income Statements S $ S S Sales Cost of goods sold Gross operating profit General admin. and selling expenses Depreciation EBIT Interest EBT Taxes (40%) Net income 2019 4,130,000 3,590,765 539,235 303,320 159,000 76,915 67,000 9,915 3,966 5.949 2018 3,750,200 2,789,000 961,200 305,000 154,500 501,700 43,000 458,700 183,480 275,220 S S S S S S Per-Share Data EPS Cash dividends Market price (average) P/E ratio Number of shares outstanding 2019 $0.26 $1.10 $12.34 47.71 23,000 2018 $11.97 $0.95 $23.57 1.97 23,000 Once we have this information set, we can calculate the necessary ratios for this analysis. 2019 2018 Industry Avga 2.7 7.0 32 13.0 2.6 Ratio Analysis Liquidity Current ratio Asset Management Inventory turnoverb Days sales outstanding Fixed assets turnoverb Total assets turnoverb Profitability Return on assets Return on equity Return on invested capital Profit margin Debt Management Debt-to-capital ratiod Market Value P/E ratio 9.1% 18.2% 14.5% 3.5% 50.0% 6.0 a Industry average ratios have been constant for the past 4 years. b Based on year-end balance sheet figures. Calculation is based on a 365-day year. d Measured as (Short-term debt +Long-term debt)/(Short-term debt +Long-term debt + Common equity)