Answered step by step
Verified Expert Solution
Link Copied!

Question

1 Approved Answer

Please answer the following questions using the data given in the table. Rank the projects by using Pay Back Period, Discounted Pay Back Period (DPBP),
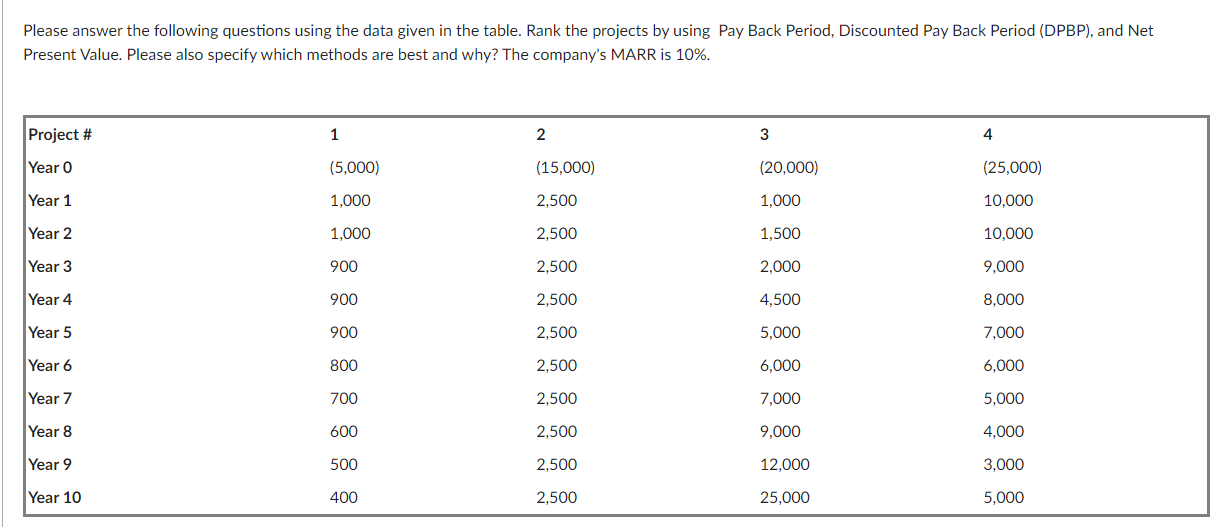
image text in transcribed

Please answer the following questions using the data given in the table. Rank the projects by using Pay Back Period, Discounted Pay Back Period (DPBP), and Net Present Value. Please also specify which methods are best and why? The company's MARR is 10%. Project # 1 2 3 4 Year 0 (5,000) (15,000) (25,000) (20,000) 1,000 Year 1 1,000 2,500 10,000 Year 2 1,000 2,500 1,500 10,000 Year 3 900 2,500 2,000 9,000 Year 4 900 2,500 4,500 8,000 Year 5 900 2,500 5,000 7,000 Year 6 800 2,500 6,000 6,000 Year 7 700 2,500 7,000 5,000 Year 8 600 2,500 9,000 4,000 Year 9 500 2,500 12,000 3,000 Year 10 400 2,500 25,000 5,000

Step by Step Solution

There are 3 Steps involved in it

Step: 1

blur-text-image

Get Instant Access to Expert-Tailored Solutions

See step-by-step solutions with expert insights and AI powered tools for academic success

Step: 2

blur-text-image

Step: 3

blur-text-image

Ace Your Homework with AI

Get the answers you need in no time with our AI-driven, step-by-step assistance

Get Started

Recommended Textbook for

Make Money Like A Monster 4 Retirement

Authors: Kaiju Cash

1st Edition

979-8853287549

More Books

Students also viewed these Finance questions

Question

=+1. Homes demand curve for wheat is Its supply curve is

Answered: 1 week ago