Answered step by step
Verified Expert Solution
Link Copied!

Question

1 Approved Answer

please answer The following table shows years of schooling and wages for 20 workers. Years of Wage Worker Schooling Income 9 19,000 14 25,000 12

please answer
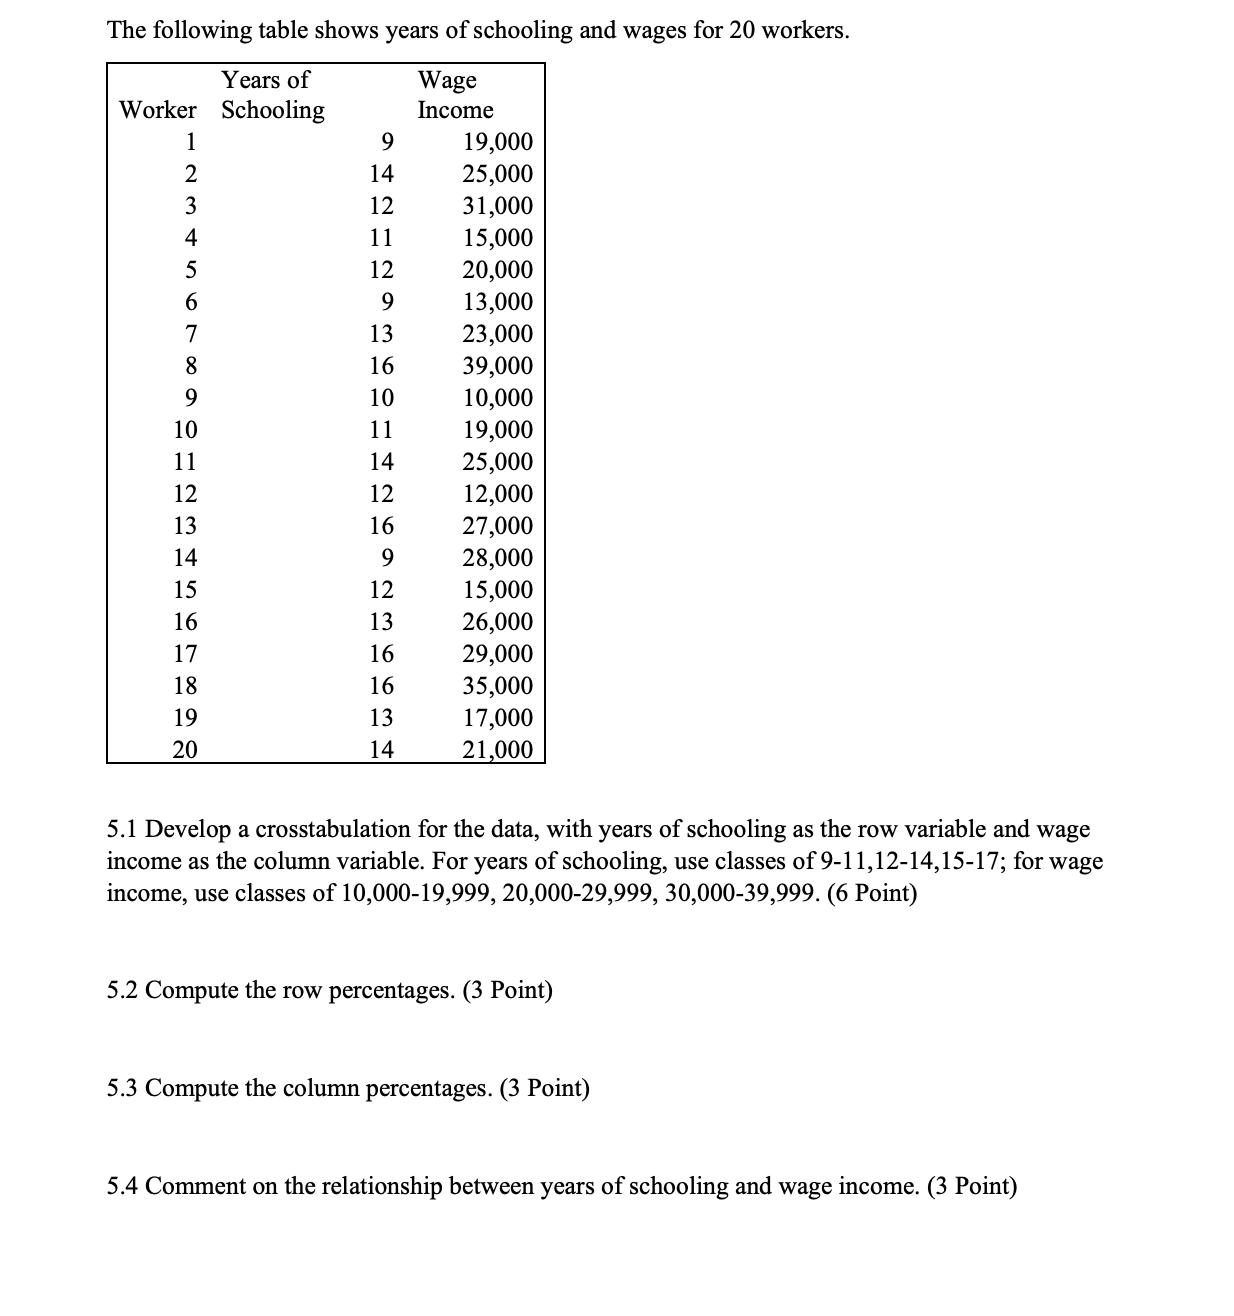
image text in transcribed
The following table shows years of schooling and wages for 20 workers. Years of Wage Worker Schooling Income 9 19,000 14 25,000 12 31,000 11 15,000 12 20,000 9 13,000 13 23,000 16 39,000 10 10,000 11 19,000 14 25,000 12 12,000 16 27,000 9 28,000 12 15,000 13 26,000 16 29,000 16 35,000 13 17,000 14 21 000 5.1 Develop a crosstabulation for the data, with years of schooling as the row variable and wage income as the column variable. For years of schooling, use classes of 9-1 1,12-14,15-17; for wage income, use classes of 10,000-19,999, 20,000-29,999, 30,000-39,999. (6 Point) 5.2 Compute the row percentages. (3 Point) 5.3 Compute the column percentages. (3 Point) 5.4 Comment on the relationship between years of schooling and wage income. (3 Point)

Step by Step Solution

There are 3 Steps involved in it

Step: 1

blur-text-image

Get Instant Access to Expert-Tailored Solutions

See step-by-step solutions with expert insights and AI powered tools for academic success

Step: 2

blur-text-image

Step: 3

blur-text-image

Ace Your Homework with AI

Get the answers you need in no time with our AI-driven, step-by-step assistance

Get Started

Recommended Textbook for

Algebra And Trigonometry

Authors: Cynthia Y Young

3rd Edition

1118475755, 9781118475751

More Books

Students also viewed these Mathematics questions