Please Answer the following:
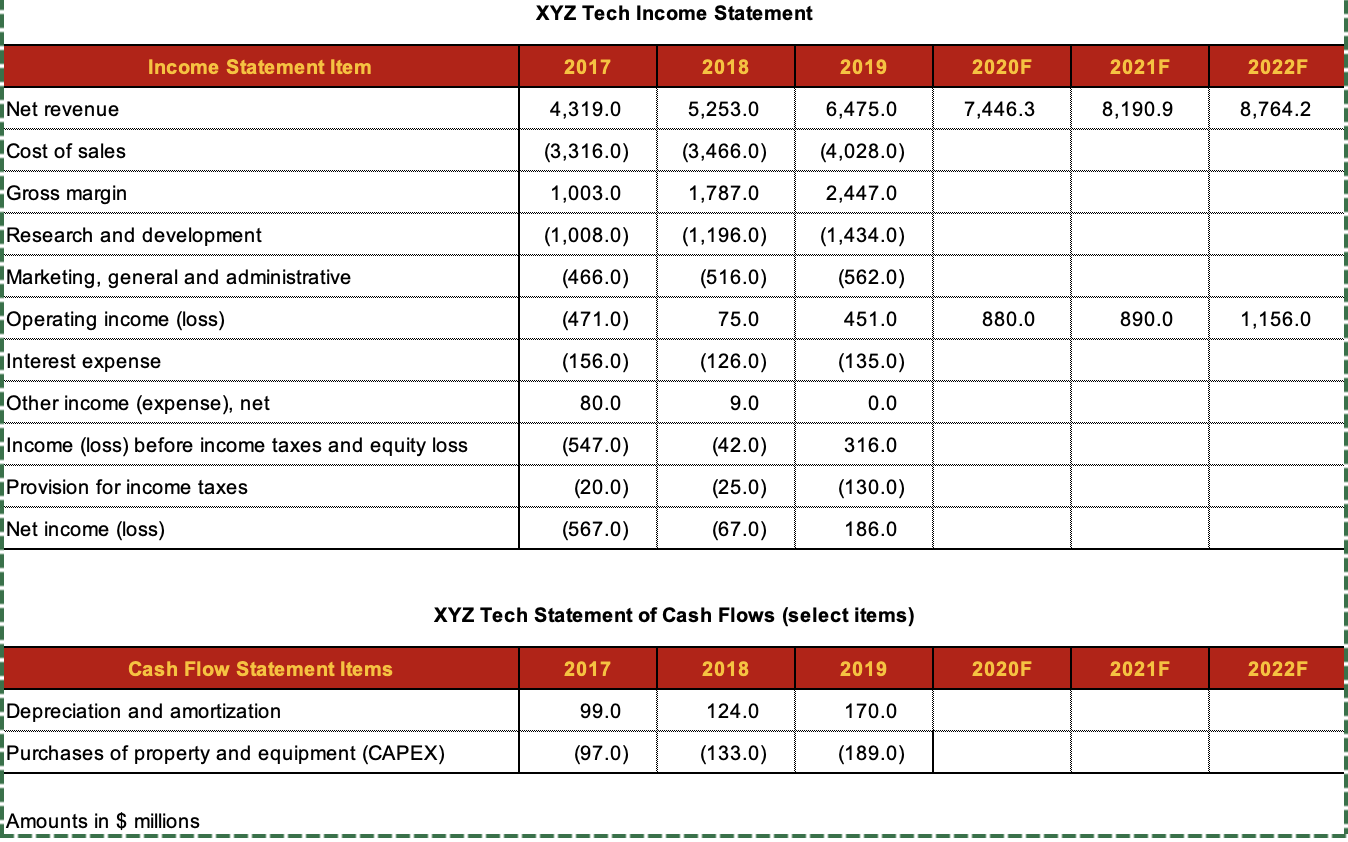
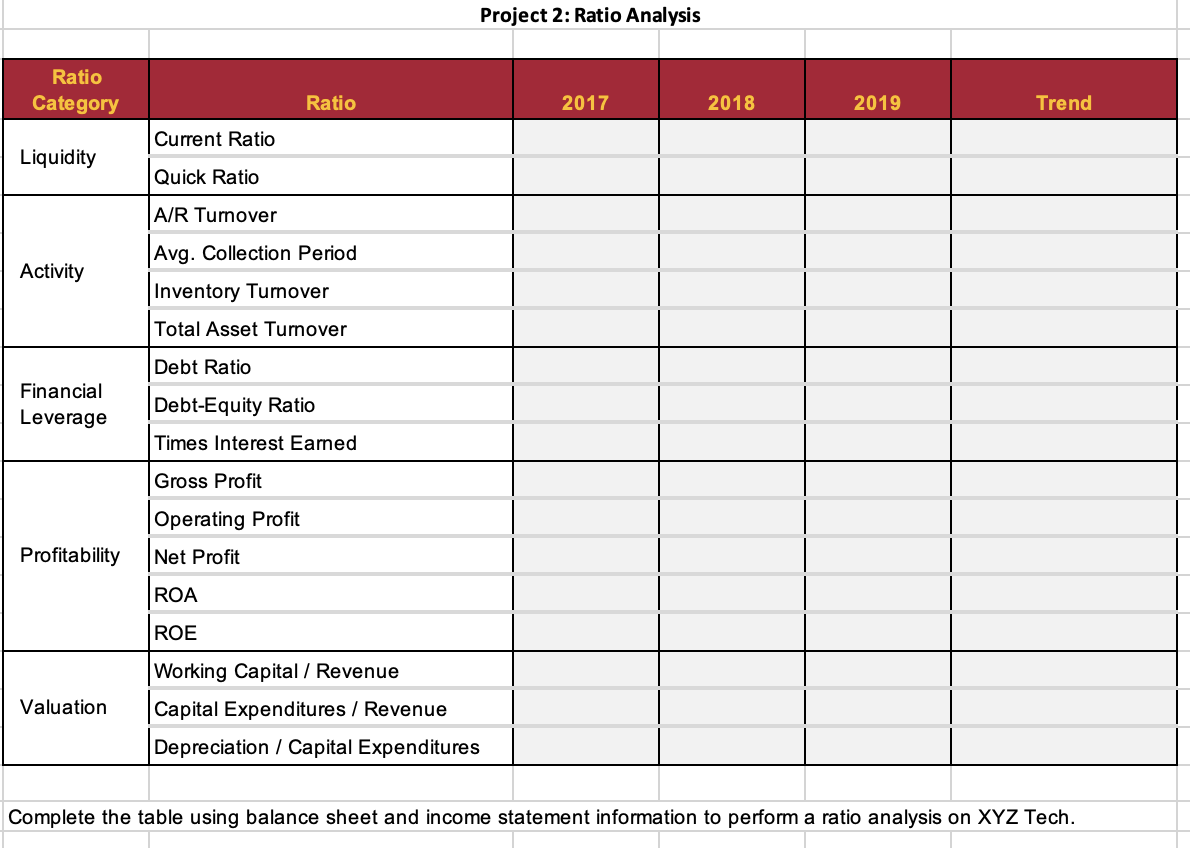
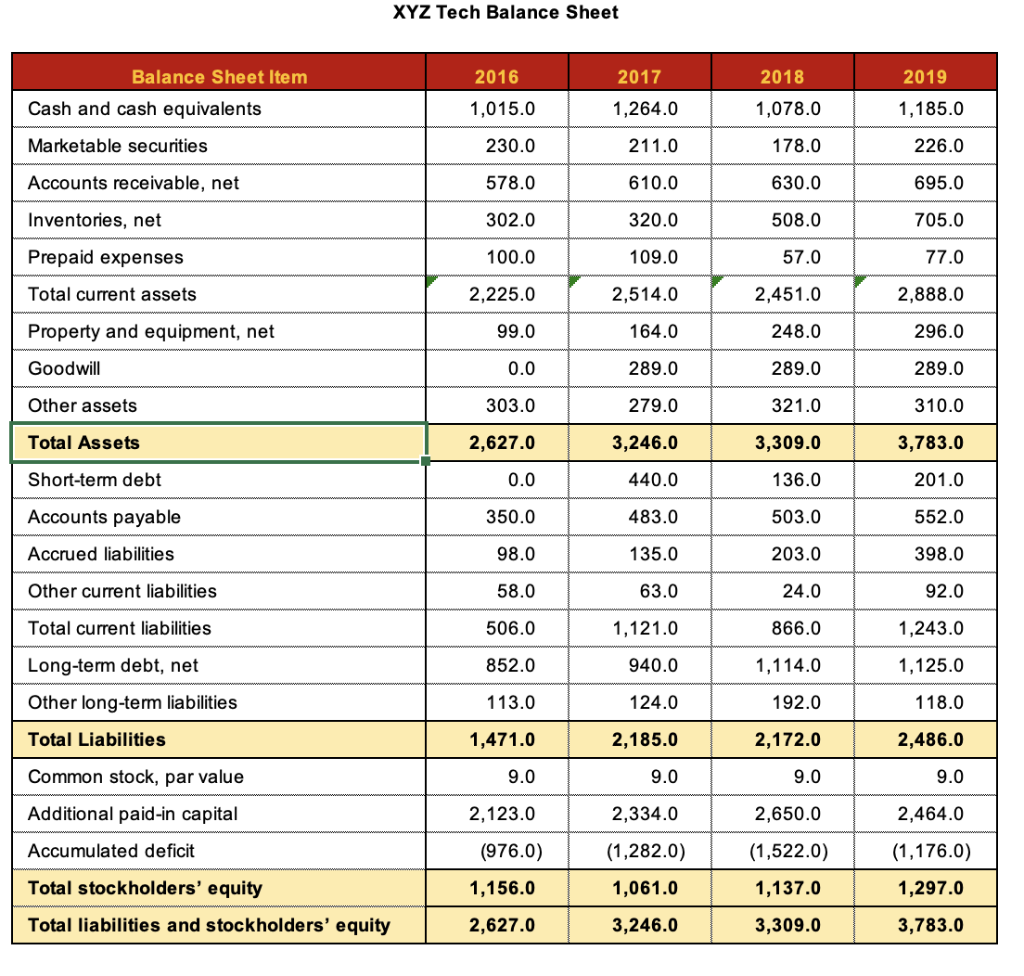
XYZ Tech Balance Sheet 2016 2017 2018 2019 Balance Sheet Item Cash and cash equivalents 1,015.0 1,264.0 1,078.0 1,185.0 Marketable securities 230.0 211.0 178.0 226.0 Accounts receivable, net 578.0 610.0 630.0 695.0 Inventories, net 302.0 320.0 508.0 705.0 Prepaid expenses 100.0 109.0 57.0 77.0 Total current assets 2,225.0 2,514.0 2,451.0 2,888.0 Property and equipment, net 99.0 164.0 248.0 296.0 Goodwill 0.0 289.0 289.0 289.0 Other assets 303.0 279.0 321.0 310.0 Total Assets 2,627.0 3,246.0 3,309.0 3,783.0 Short-term debt 0.0 440.0 136.0 201.0 Accounts payable 350.0 483.0 503.0 552.0 Accrued liabilities 98.0 135.0 203.0 398.0 Other current liabilities 58.0 63.0 24.0 92.0 Total current liabilities 506.0 1,121.0 866.0 1,243.0 Long-term debt, net 852.0 940.0 1,114.0 1,125.0 Other long-term liabilities 113.0 124.0 192.0 118.0 Total Liabilities 1,471.0 2,185.0 2,172.0 2,486.0 Common stock, par value 9.0 9.0 9.0 9.0 Additional paid-in capital 2,123.0 2,334.0 2,650.0 2,464.0 Accumulated deficit (976.0) 1,156.0 (1,282.0) 1,061.0 (1,522.0) 1,137.0 (1,176.0) 1,297.0 Total stockholders' equity Total liabilities and stockholders' equity 2,627.0 3,246.0 3,309.0 3,783.0 XYZ Tech Income Statement Income Statement Item 2017 2018 2019 2020F 2021F 2022F Net revenue 4,319.0 5,253.0 6,475.0 7,446.3 8,190.9 8,764.2 Cost of sales (3,316.0) (3,466.0) (4,028.0) Gross margin 1,003.0 1,787.0 2,447.0 Research and development (1,196.0) (1,434.0) Marketing, general and administrative (1,008.0) (466.0) (471.0) (516.0) (562.0) Operating income (loss) 75.0 451.0 880.0 890.0 1,156.0 Interest expense (156.0) (126.0) (135.0) Other income (expense), net 80.0 9.0 0.0 Income (loss) before income taxes and equity loss (547.0) (42.0) 316.0 Provision for income taxes (20.0) (130.0) (25.0) (67.0) Net income (loss) (567.0) 186.0 XYZ Tech Statement of Cash Flows (select items) Cash Flow Statement Items 2017 2018 2019 2020F 2021F 2022F Depreciation and amortization 99.0 124.0 170.0 Purchases of property and equipment (CAPEX) (97.0) (133.0) (189.0) Amounts in $ millions -- - 1 i 1 - - - - - H i - - Project 2: Ratio Analysis Ratio Category Ratio 2017 2018 2019 Trend Current Ratio Liquidity Quick Ratio A/R Turnover Avg. Collection Period Activity Inventory Turnover Total Asset Turnover Debt Ratio Financial Leverage Debt-Equity Ratio Times Interest Earned Gross Profit Operating Profit Profitability Net Profit ROA ROE Valuation Working Capital / Revenue Capital Expenditures / Revenue Depreciation / Capital Expenditures Complete the table using balance sheet and income statement information to perform a ratio analysis on XYZ Tech. XYZ Tech Balance Sheet 2016 2017 2018 2019 Balance Sheet Item Cash and cash equivalents 1,015.0 1,264.0 1,078.0 1,185.0 Marketable securities 230.0 211.0 178.0 226.0 Accounts receivable, net 578.0 610.0 630.0 695.0 Inventories, net 302.0 320.0 508.0 705.0 Prepaid expenses 100.0 109.0 57.0 77.0 Total current assets 2,225.0 2,514.0 2,451.0 2,888.0 Property and equipment, net 99.0 164.0 248.0 296.0 Goodwill 0.0 289.0 289.0 289.0 Other assets 303.0 279.0 321.0 310.0 Total Assets 2,627.0 3,246.0 3,309.0 3,783.0 Short-term debt 0.0 440.0 136.0 201.0 Accounts payable 350.0 483.0 503.0 552.0 Accrued liabilities 98.0 135.0 203.0 398.0 Other current liabilities 58.0 63.0 24.0 92.0 Total current liabilities 506.0 1,121.0 866.0 1,243.0 Long-term debt, net 852.0 940.0 1,114.0 1,125.0 Other long-term liabilities 113.0 124.0 192.0 118.0 Total Liabilities 1,471.0 2,185.0 2,172.0 2,486.0 Common stock, par value 9.0 9.0 9.0 9.0 Additional paid-in capital 2,123.0 2,334.0 2,650.0 2,464.0 Accumulated deficit (976.0) 1,156.0 (1,282.0) 1,061.0 (1,522.0) 1,137.0 (1,176.0) 1,297.0 Total stockholders' equity Total liabilities and stockholders' equity 2,627.0 3,246.0 3,309.0 3,783.0 XYZ Tech Income Statement Income Statement Item 2017 2018 2019 2020F 2021F 2022F Net revenue 4,319.0 5,253.0 6,475.0 7,446.3 8,190.9 8,764.2 Cost of sales (3,316.0) (3,466.0) (4,028.0) Gross margin 1,003.0 1,787.0 2,447.0 Research and development (1,196.0) (1,434.0) Marketing, general and administrative (1,008.0) (466.0) (471.0) (516.0) (562.0) Operating income (loss) 75.0 451.0 880.0 890.0 1,156.0 Interest expense (156.0) (126.0) (135.0) Other income (expense), net 80.0 9.0 0.0 Income (loss) before income taxes and equity loss (547.0) (42.0) 316.0 Provision for income taxes (20.0) (130.0) (25.0) (67.0) Net income (loss) (567.0) 186.0 XYZ Tech Statement of Cash Flows (select items) Cash Flow Statement Items 2017 2018 2019 2020F 2021F 2022F Depreciation and amortization 99.0 124.0 170.0 Purchases of property and equipment (CAPEX) (97.0) (133.0) (189.0) Amounts in $ millions -- - 1 i 1 - - - - - H i - - Project 2: Ratio Analysis Ratio Category Ratio 2017 2018 2019 Trend Current Ratio Liquidity Quick Ratio A/R Turnover Avg. Collection Period Activity Inventory Turnover Total Asset Turnover Debt Ratio Financial Leverage Debt-Equity Ratio Times Interest Earned Gross Profit Operating Profit Profitability Net Profit ROA ROE Valuation Working Capital / Revenue Capital Expenditures / Revenue Depreciation / Capital Expenditures Complete the table using balance sheet and income statement information to perform a ratio analysis on XYZ Tech