^^^^^^^^^^^^^^^^^^^^^^^^^^^^^^^^^^^^^^^^^^^^^^^^^^^^^^^^^^^^^^^^^^^^^^^^^^^^^^^^^^^^^^^^^^^^^^^^^
Please answer the instructions above based on the case below, thank you for your help.
(Answer will be scanned, including other Chegg answers, thumbs down for plagiarism)
__________________________________________________________________________________
Case 14:
In early 2014, stock performance at Minneapolis-based Chestnut Foods (Chestnut) had failed to meet expectations for several years running, and senior management was hard-pressed to talk about much else. CFO Brenda Pedersen, eager to reverse the trend, had begun advocating two strategic initiatives: a $1 billion investment in company growth and the adoption of a more progressive corporate identity. At a restaurant overlooking the Mississippi River, Pedersen hosted an informal meeting of company VPs to build support; exchanges had been highly spirited, but no consensus had materialized. Then, on her drive home from the restaurant, she received a call from Claire Meyer, VP of Food Products, who had attended the dinner. Given the tone of the meeting, Pedersen wasnt surprised to get a call so soon, but what Meyer shared floored the CFO. It just came up on Twitter. My admin saw it and texted me. Im not going to say I told you so.
Meyer read her the tweet. Van Muur buys 10% of Chestnut, seeks seats on board and a new management direction. Meyer filled in the details: based on filings earlier in the day with the U.S. Securities and Exchange Commission, Rollo van Muur, a high-profile activist investor, had quietly and unexpectedly purchased 10% of the company and was asserting the right to two seats on the board. In addition, Van Muur was recommending that the Instruments division be sold off to keep the focus where it belongs.
Pedersen drove in shocked silence and processed the information while Meyer waited patiently on the line, not sure what to expect. When Pedersen finally responded, she fell back on humor: Well, thats one way to move the discussion along, but he could have just come to dinner with us. By the end of the night, she had spoken with CEO Moss Thornton and organized a team of lawyers and finance staff to assess the companys options.
Chestnut Foods began in north Minneapolis in 1887, when 22-year-old Otto Chestnut (born Otto Kestenbaum in Bavaria) opened a bakery that made lye rolls and pretzels, then stumbled into success as a supplier of sandwiches to the St. Paul, Minneapolis, Page 208& Manitoba Railway. Six years later, on a trip to Chicago, Illinois, to visit the Columbian Exposition, Chestnut happened to come upon the Maxwell Street Market, a vibrant melting-pot community of merchants of eastern European descent. At the market, he had a chance meeting with Lem Vigoda and George Maszk, founders of V&M Classic Foods, which provided a range of meat and fish products as well as preserves and condiments. Through them he witnessed a nascent ad hoc distribution system to neighborhood groceries in the rapidly growing city. A vision of wholesale food production and distribution struck him, and he returned to Minneapolis determined to realize it.
By 1920, as regional grocery chains had begun to materialize, Chestnut, since joined by his sons Thomas and Andrew, had purchased V&M among other food businesses. Their plan was for the expanded Chestnut to stock the regional grocery chains across the upper Midwest, while also continuing to supply railroad dining cars and, beginning in 1921, a Chestnut chain of automats in Chicago and Detroit. Otto Chestnut died in 1927 at age 62, but the company was well positioned to weather the Great Depression; in 1935, the Chestnut brothers sold the automat division to Horn & Hardart, then used the proceeds to purchase farmland in Florida and central California. In the postwar period, as the supermarket model emerged, Chestnut grew with it, both organically and through acquisition, going public in 1979. By 2013, the company was valued at $1.8 billion, with annual profits of more than $130 million.
Chestnut sought to provide hearty sustenance that gets you where youre going. The firm had two main business segments: Food Products, which produced a broad range of fresh, prepackaged, and processed foods for retail and food services, and Instruments, which delivered systems and specialized equipment used in the processing and packaging of food products. Instruments provided a variety of quality control and automation services used within the company. The company took increasing pride in the high quality of its manufacturing process and believed it to be an important differentiator among both investors and consumers.
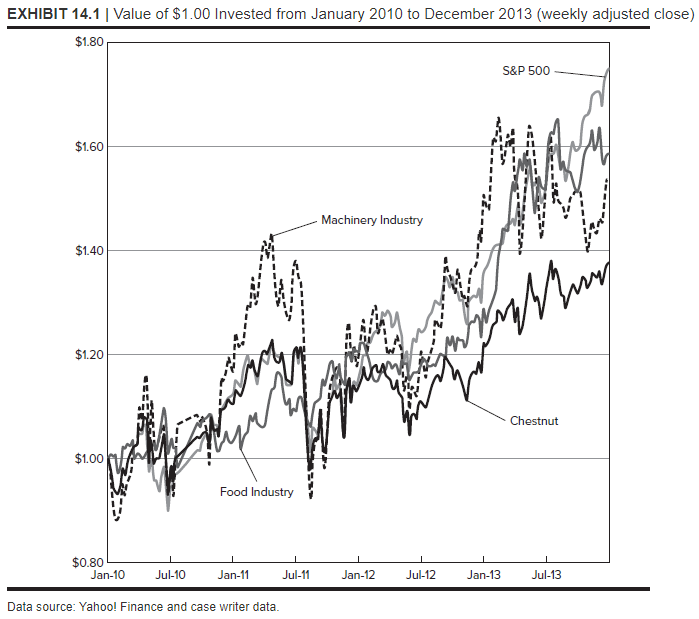
In recent years, Chestnuts shares had failed to keep pace with either the overall stock market or industry indexes for foods or machinery (see Exhibit 14.1). The companys credit rating with Standard & Poors had recently declined one notch to A. Securities analysts had remarked on the firms lackluster earnings growth, pointing to increasing competition in the food industry due to shifting demands. One prominent Wall Street analyst noted on his blog, Chestnut has become as vulnerable to a hostile takeover as a vacant umbrella on a hot beach.
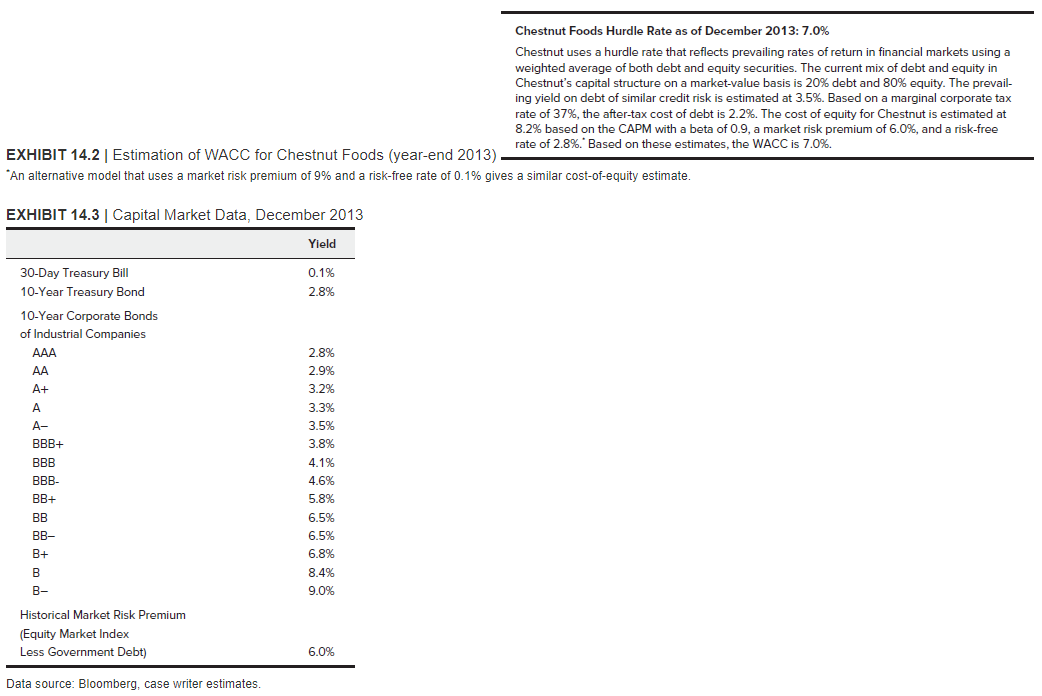
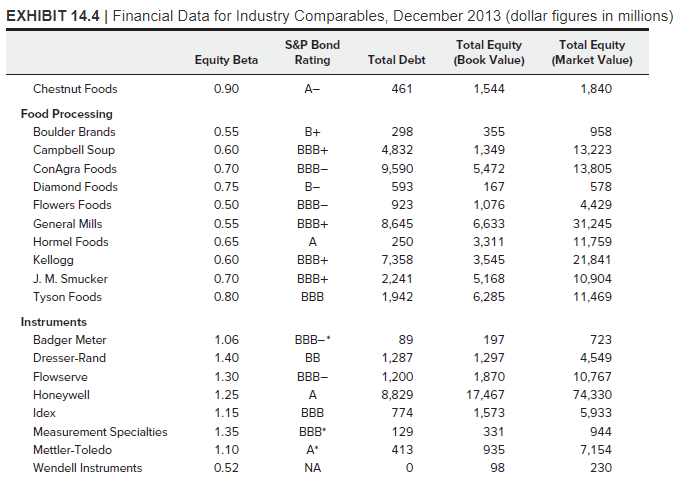
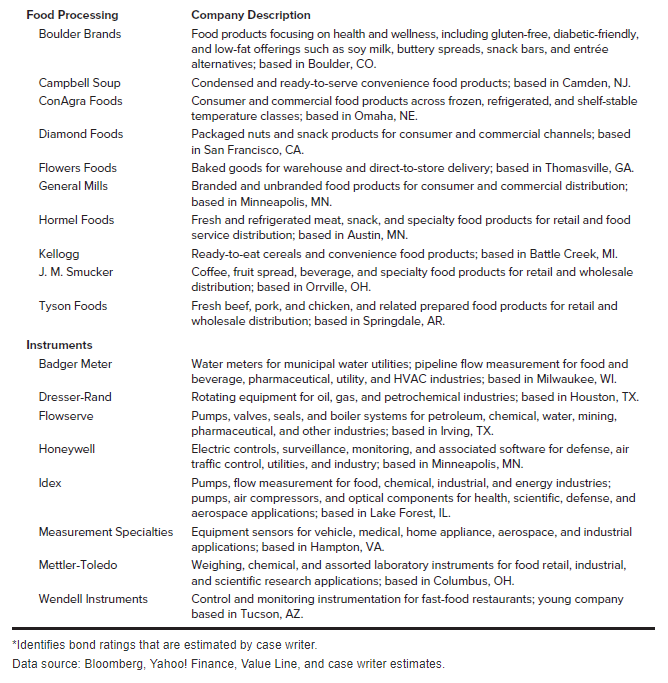
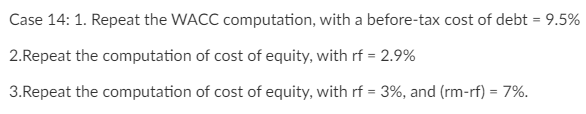
Case 14: 1. Repeat the WACC computation, with a before-tax cost of debt =9.5% 2. Repeat the computation of cost of equity, with rf=2.9% 3. Repeat the computation of cost of equity, with rf=3%, and (rmrf)=7%. Data source: Yahoo! Finance and case writer data. (Figure 14.1) before continuing. Chestnut Foods Hurdle Rate as of December 2013: 7.0\% Chestnut uses a hurdle rate that reflects prevailing rates of return in financial markets using a weighted average of both debt and equity securities. The current mix of debt and equity in Chestnut's capital structure on a market-value basis is 20% debt and 80% equity. The prevailing yield on debt of similar credit risk is estimated at 3.5%. Based on a marginal corporate tax rate of 37%, the after-tax cost of debt is 2.2%. The cost of equity for Chestnut is estimated at 8.2% based on the CAPM with a beta of 0.9 , a market risk premium of 6.0%, and a risk-free EXHIBIT 14.2 | Estimation of WACC for Chestnut Foods (year-end 2013) rate of 2.8\%." Based on these estimates, the WACC is 7.0%. "An alternative model that uses a market risk premium of 9% and a risk-free rate of 0.1% gives a similar cost-of-equity estimate. Data source: Bloomberg, case writer estimates. EXHIBIT 14.4 | Financial Data for Industry Comparables, December 2013 (dollar figures in millions) Company Description Food products focusing on health and wellness, including gluten-free, diabetic-friendly, and low-fat offerings such as soy milk, buttery spreads, snack bars, and entre alternatives; based in Boulder, CO. Condensed and ready-to-serve convenience food products; based in Camden, NJ. Consumer and commercial food products across frozen, refrigerated, and shelf-stable temperature classes; based in Omaha, NE. Packaged nuts and snack products for consumer and commercial channels; based in San Francisco, CA. Baked goods for warehouse and direct-to-store delivery; based in Thomasville, GA. Branded and unbranded food products for consumer and commercial distribution; based in Minneapolis, MN. Fresh and refrigerated meat, snack, and specialty food products for retail and food service distribution; based in Austin, MN. Ready-to-eat cereals and convenience food products; based in Battle Creek, MI. Coffee, fruit spread, beverage, and specialty food products for retail and wholesale distribution; based in Orrville, OH. Fresh beef, pork, and chicken, and related prepared food products for retail and wholesale distribution; based in Springdale, AR. Water meters for municipal water utilities; pipeline flow measurement for food and beverage, pharmaceutical, utility, and HVAC industries; based in Milwaukee, WI. Rotating equipment for oil, gas, and petrochemical industries; based in Houston, TX. Pumps, valves, seals, and boiler systems for petroleum, chemical, water, mining, pharmaceutical, and other industries; based in lrving, TX. Electric controls, surveillance, monitoring, and associated software for defense, air traffic control, utilities, and industry; based in Minneapolis, MN. Pumps, flow measurement for food, chemical, industrial, and energy industries; pumps, air compressors, and optical components for health, scientific, defense, and aerospace applications; based in Lake Forest, IL. is Equipment sensors for vehicle, medical, home appliance, aerospace, and industrial applications; based in Hampton, VA. Weighing, chemical, and assorted laboratory instruments for food retail, industrial, and scientific research applications; based in Columbus, OH. Control and monitoring instrumentation for fast-food restaurants; young company based in Tucson, AZ. are estimated by case writer. Data source: Bloomberg, Yahoo! Finance, Value Line, and case writer estimates. 767 Case 14: Chestnut Foods 768 In 2014, the stock performance at Chestnut Foods had failed to meet expectations for several years. 769 Van Muur bought 10% of Chestnut, sought seats on the board, and a new management direction. 770 Food Products Division: The Food Products Division provided products related to the bread and sandwich market for 771 institutional food services and retail grocery distribution. 772 The Instruments Division produced equipment and automation support for food producers in North America. 773 Investors expect returns that beat the cost of capital of 7% 774 Questions 775 1. Summarize the performance of the Food Products Division and the Instruments Division. 776 2. What should Pedersen do? 777 Weighted Average Cost of Capital for Chestnut 778 Chestnut Foods 779 Cost of equity 780rf+ beta(market risk premium) CAPM Capital asset pricing model 781 782 Cost of debt 783 After tax cost of debt = Before tax cost (1 Tax rate ) 784 785 WACC Weighted Average Cost of Capital Debt/(Debt + Equity) After tax cost of debt + Equity/(Debt + Equity) )cost of equity 0.0697787926.90% Food Products 789 Assets 1400000000 790 Instruments 791 Assets 792 Weight of Food Products 793 Weight of Instruments 794 WACC Food Products Weight of Food Products*Hurdle Rate \begin{tabular}{|r|r|} \hline 0.0483 & 4.80% \\ \hline 0.0207 & 2.07% \\ \hline \end{tabular} Weighted Average Cost of Capital Debt/(Debt + Equity) After tax cost of debt + Equity/(Debt + Equity) )cost of equity 801 0.069 6.90% 809 Weighted Average Cost of Capital for Boulder Brands Boulder Brands Cost of equity 812rf+ beta(market risk premium) CAPM Capital asset pricing model 813 814 Cost of debt 815 After tax cost of debt = Before tax cost (1 Tax rate ) 0.0408 817 WACC Weighted Average Cost of Capital Debt/(Debt + Equity) After tax cost of debt + Equity/(Debt + Equity) cost of equity 0.0562073255.60%lessroskythanChestnut Campbell Soup Cost of equity 822rf+ beta(market risk premium) CAPM capital asset pricing model 823 824 Cost of debt 825 After tax cost of debt = Before tax cost* (1 Tax rate ) 0.0228 WACC Weighted Average Cost of Capital Debt/(Debt + Equity) After tax cost of debt + Equity/(Debt + Equity) cost of equity 0.052973785.29% less risky than Chestnut ConAgra Foods Cost of equity 832rf+ beta(market risk premium) CAPM capital asset pricing model 833 834 Cost of debt 835 After tax cost of debt = Before tax cost (1 Tax rate ) 0.0276 WACC Weighted Average Cost of Capital Debt/(Debt + Equity) After tax cost of debt + Equity/(Debt + Equity) cost of equity 0.0526195345.29% less risky than Chestnut Diamond Foods 842 Cost of equity 843rf+ beta(market risk premium) CAPM capital asset pricing model 844 0.073 899 Weighted Average Cost of Capital for Chestnut Chestnut Foods cost of equity rf+ beta(market risk premium) CAPM capital asset pricing model 0.082 Cost of debt After tax cost of debt = Before taxcost(1 Tax rate ) 0.021 Weighted Average Cost of Capital Debt/(Debt + Equity) After tax cost of debt + Equity/(Debt + Equity) * cost of equity 0.0697787926.90% Weighted Average Cost of Capital for Chestnut Chestnut Foods Cost of equity rf + beta(market risk premium) CAPM capital asset pricing model 0.082 Cost of debt After tax cost of debt = Before taxcos(1 Tax rate ) 0.021 Weighted Average Cost of Capital Debt/(Debt + Equity) *After tax cost of debt + Equity/(Debt + Equity) cos cof equity 0.069778792 Weighted Average Cost of Capital for Chestnut Chestnut Foods Cost of equity rf + beta(market risk premium) CAPM Capital asset pricing model 0.082 cost of debt After tax cost of debt = Before taxcos(1 Tax rate ) 0.021 WACC Weighted Average Cost of Capital Debt/(Debt + Equity) *fter tax cost of debt + Equity/(Debt + Equity) *cost of equity 0.0697787926.90% Weighted Average Cost of Capital for Chestnut Chestnut Foods $165.04$182.98