 PLEASE ANSWER THE MARKET VALUES AND FREE CASH FLOWS. ALSO CAN YOU PLESE VERIFY THE RATIOS ARE CORRECTLY CALCULATED. THANK YOU!!!!!
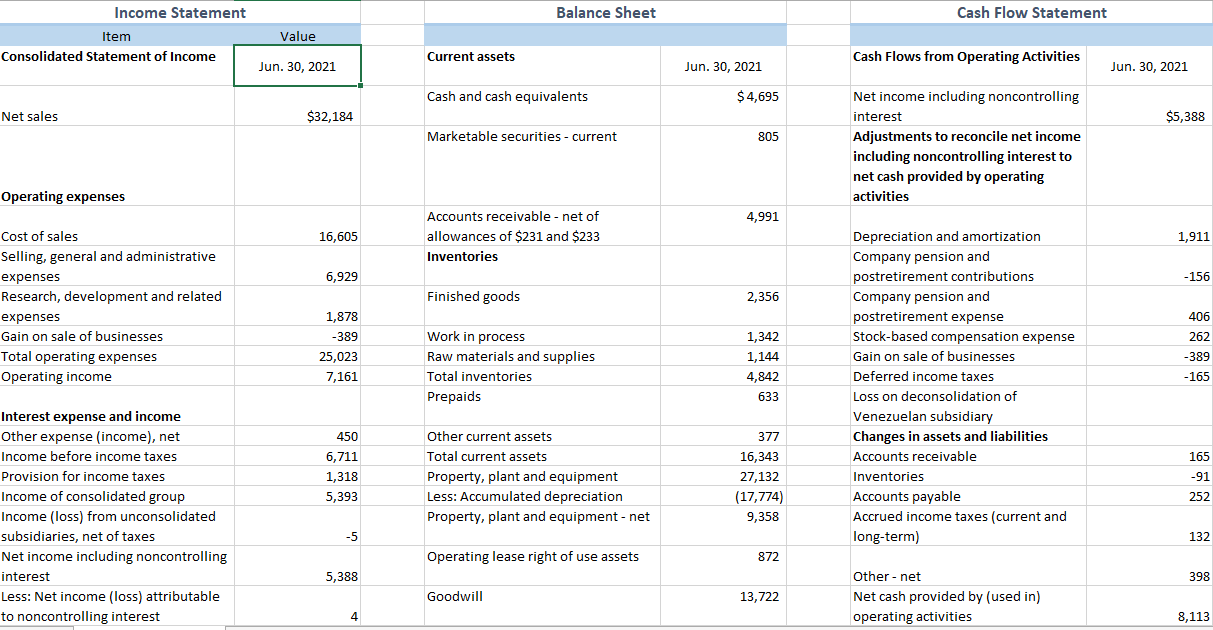
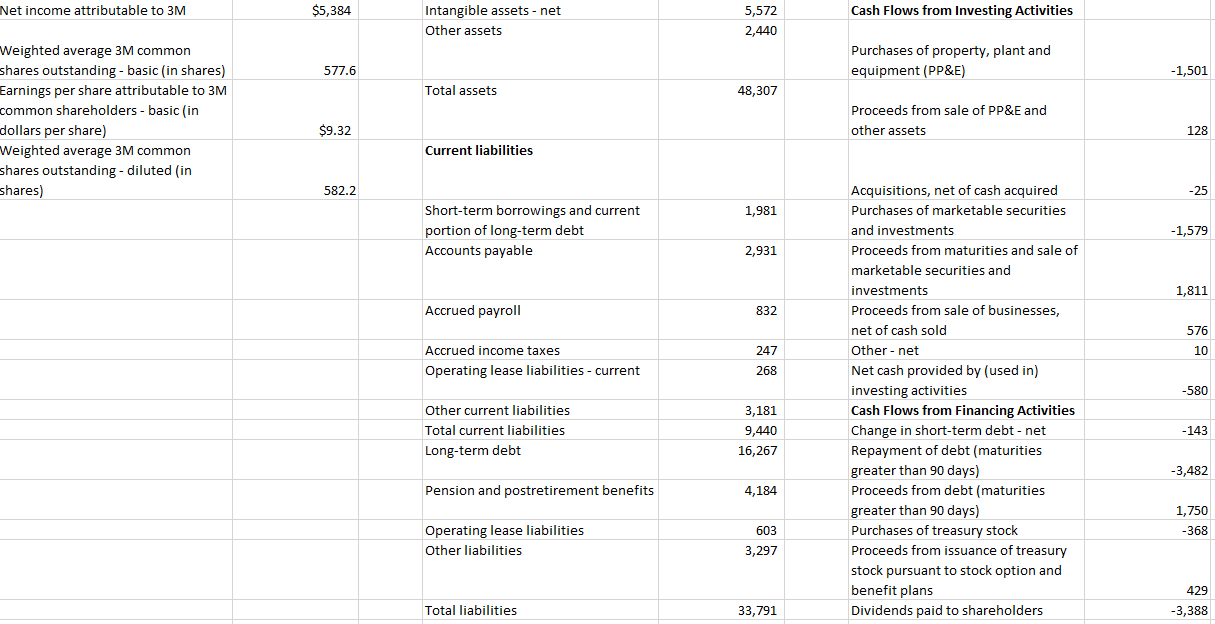
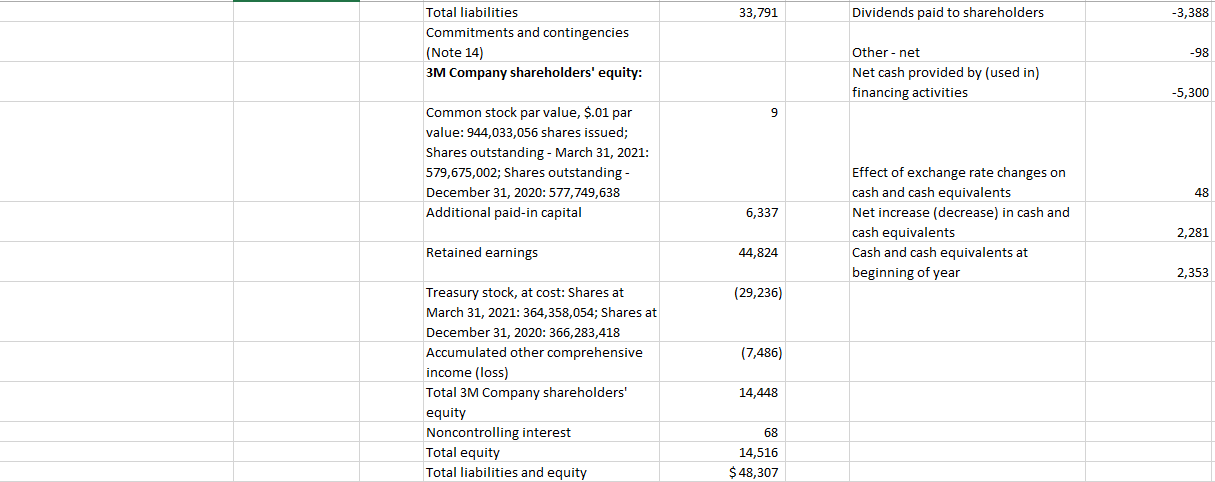
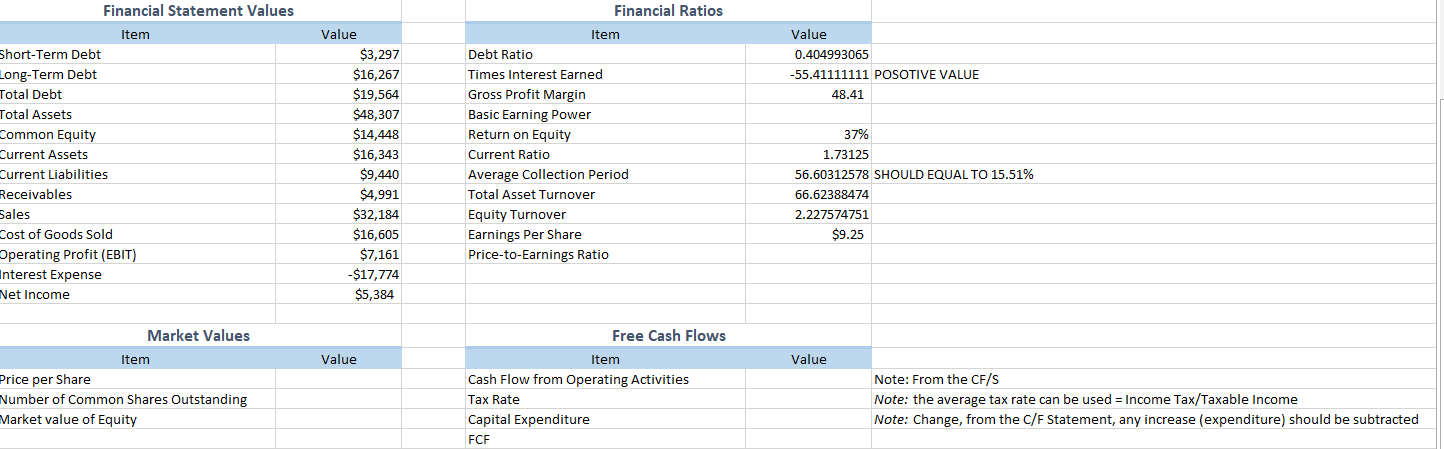
Balance Sheet Cash Flow Statement Income Statement Item Consolidated Statement of Income Value Current assets Cash Flows from Operating Activities Jun. 30, 2021 Jun. 30, 2021 Jun. 30, 2021 Cash and cash equivalents $4,695 Net sales $32,184 $5,388 Marketable securities - current 805 Net income including noncontrolling interest Adjustments to reconcile net income including noncontrolling interest to net cash provided by operating activities Operating expenses 4,991 16,605 Accounts receivable - net of allowances of $231 and $233 Inventories 1,911 6,929 -156 Finished goods 2,356 Cost of sales Selling, general and administrative expenses Research, development and related expenses Gain on sale of businesses Total operating expenses Operating income 1,878 -389 25,023 7,161 Work in process Raw materials and supplies Total inventories Prepaids 1,342 1,144 4,842 406 262 -389 - 165 Depreciation and amortization Company pension and postretirement contributions Company pension and postretirement expense Stock-based compensation expense Gain on sale of businesses Deferred income taxes Loss on deconsolidation of Venezuelan subsidiary Changes in assets and liabilities Accounts receivable Inventories Accounts payable Accrued income taxes (current and long-term) 633 377 16,343 450 6,711 1,318 5,393 Other current assets Total current assets Property, plant and equipment Less: Accumulated depreciation Property, plant and equipment - net 27,132 Interest expense and income Other expense (income), net Income before income taxes Provision for income taxes Income of consolidated group Income (loss) from unconsolidated subsidiaries, net of taxes Net income including noncontrolling interest Less: Net income (loss) attributable to noncontrolling interest 165 -91 252 (17,774) 9,358 -5 132 Operating lease right of use assets 872 5,388 398 Goodwill 13,722 Other - net Net cash provided by (used in) operating activities 4 8,113 Net income attributable to 3M $5,384 5,384 Cash Flows from Investing Activities Intangible assets - net Other assets 5,572 2,440 Purchases of property, plant and equipment (PP&E) 577.6 - 1,501 Total assets 48,307 Weighted average 3M common shares outstanding - basic in shares) Earnings per share attributable to 3M common shareholders - basic (in dollars per share) Weighted average 3M common shares outstanding - diluted in shares) Proceeds from sale of PP&E and other assets $9.32 128 Current liabilities 582.2 -25 1,981 Short-term borrowings and current portion of long-term debt Accounts payable -1,579 2,931 1,811 Accrued payroll 832 576 10 Accrued income taxes Operating lease liabilities - current 247 268 -580 Acquisitions, net of cash acquired Purchases of marketable securities and investments Proceeds from maturities and sale of marketable securities and investments Proceeds from sale of businesses, net of cash sold Other - net Net cash provided by (used in) investing activities Cash Flows from Financing Activities Change in short-term debt-net Repayment of debt (maturities greater than 90 days) Proceeds from debt (maturities greater than 90 days) Purchases of treasury stock Proceeds from issuance of treasury stock pursuant to stock option and benefit plans Dividends paid to shareholders Other current liabilities Total current liabilities Long-term debt 3,181 9,440 16,267 -143 -3,482 Pension and postretirement benefits 4,184 1,750 -368 Operating lease liabilities Other liabilities 603 3,297 429 -3,388 Total liabilities 33,791 33,791 Dividends paid to shareholders -3,388 Total liabilities Commitments and contingencies (Note 14) 3M Company shareholders' equity: -98 Other - net Net cash provided by (used in) financing activities -5,300 9 Common stock par value, $.01 par value: 944,033,056 shares issued; Shares outstanding - March 31, 2021: 579,675,002; Shares outstanding - December 31, 2020: 577,749,638 Additional paid-in capital 48 6,337 Effect of exchange rate changes on cash and cash equivalents Net increase (decrease) in cash and cash equivalents Cash and cash equivalents at beginning of year 2,281 Retained earnings 44,824 2,353 (29,236) (7,486) Treasury stock, at cost: Shares at March 31, 2021: 364,358,054; Shares at December 31, 2020: 366,283,418 Accumulated other comprehensive income (loss) Total 3M Company shareholders' equity Noncontrolling interest Total equity Total liabilities and equity 14,448 68 14,516 $ 48,307 Financial Ratios Value 0.404993065 -55.41111111 POSOTIVE VALUE 48.41 Financial Statement Values Item Short-Term Debt Long-Term Debt Total Debt Total Assets Common Equity Current Assets Current Liabilities Receivables Sales Cost of Goods Sold Operating Profit (EBIT) Interest Expense Net Income Value $3,297 $16,267 $19,564 $48,307 $14,448 $16,343 $9,440 $4,991 $32,184 $16,605 $7,161 -$17,774 $5,384 Item Debt Ratio Times Interest Earned Gross Profit Margin Basic Earning Power Return on Equity Current Ratio Average Collection Period Total Asset Turnover Equity Turnover Earnings Per Share Price-to-Earnings Ratio 37% 1.73125 56.60312578 SHOULD EQUAL TO 15.51% 66.62388474 2.227574751 $9.25 Value Value Market Values Item Price per Share Number of Common Shares Outstanding Market value of Equity Free Cash Flows Item Cash Flow from Operating Activities Tax Rate Capital Expenditure FCF Note: From the CF/S Note: the average tax rate can be used = Income Tax/Taxable income Note: Change, from the C/F Statement, any increase (expenditure) should be subtracted Balance Sheet Cash Flow Statement Income Statement Item Consolidated Statement of Income Value Current assets Cash Flows from Operating Activities Jun. 30, 2021 Jun. 30, 2021 Jun. 30, 2021 Cash and cash equivalents $4,695 Net sales $32,184 $5,388 Marketable securities - current 805 Net income including noncontrolling interest Adjustments to reconcile net income including noncontrolling interest to net cash provided by operating activities Operating expenses 4,991 16,605 Accounts receivable - net of allowances of $231 and $233 Inventories 1,911 6,929 -156 Finished goods 2,356 Cost of sales Selling, general and administrative expenses Research, development and related expenses Gain on sale of businesses Total operating expenses Operating income 1,878 -389 25,023 7,161 Work in process Raw materials and supplies Total inventories Prepaids 1,342 1,144 4,842 406 262 -389 - 165 Depreciation and amortization Company pension and postretirement contributions Company pension and postretirement expense Stock-based compensation expense Gain on sale of businesses Deferred income taxes Loss on deconsolidation of Venezuelan subsidiary Changes in assets and liabilities Accounts receivable Inventories Accounts payable Accrued income taxes (current and long-term) 633 377 16,343 450 6,711 1,318 5,393 Other current assets Total current assets Property, plant and equipment Less: Accumulated depreciation Property, plant and equipment - net 27,132 Interest expense and income Other expense (income), net Income before income taxes Provision for income taxes Income of consolidated group Income (loss) from unconsolidated subsidiaries, net of taxes Net income including noncontrolling interest Less: Net income (loss) attributable to noncontrolling interest 165 -91 252 (17,774) 9,358 -5 132 Operating lease right of use assets 872 5,388 398 Goodwill 13,722 Other - net Net cash provided by (used in) operating activities 4 8,113 Net income attributable to 3M $5,384 5,384 Cash Flows from Investing Activities Intangible assets - net Other assets 5,572 2,440 Purchases of property, plant and equipment (PP&E) 577.6 - 1,501 Total assets 48,307 Weighted average 3M common shares outstanding - basic in shares) Earnings per share attributable to 3M common shareholders - basic (in dollars per share) Weighted average 3M common shares outstanding - diluted in shares) Proceeds from sale of PP&E and other assets $9.32 128 Current liabilities 582.2 -25 1,981 Short-term borrowings and current portion of long-term debt Accounts payable -1,579 2,931 1,811 Accrued payroll 832 576 10 Accrued income taxes Operating lease liabilities - current 247 268 -580 Acquisitions, net of cash acquired Purchases of marketable securities and investments Proceeds from maturities and sale of marketable securities and investments Proceeds from sale of businesses, net of cash sold Other - net Net cash provided by (used in) investing activities Cash Flows from Financing Activities Change in short-term debt-net Repayment of debt (maturities greater than 90 days) Proceeds from debt (maturities greater than 90 days) Purchases of treasury stock Proceeds from issuance of treasury stock pursuant to stock option and benefit plans Dividends paid to shareholders Other current liabilities Total current liabilities Long-term debt 3,181 9,440 16,267 -143 -3,482 Pension and postretirement benefits 4,184 1,750 -368 Operating lease liabilities Other liabilities 603 3,297 429 -3,388 Total liabilities 33,791 33,791 Dividends paid to shareholders -3,388 Total liabilities Commitments and contingencies (Note 14) 3M Company shareholders' equity: -98 Other - net Net cash provided by (used in) financing activities -5,300 9 Common stock par value, $.01 par value: 944,033,056 shares issued; Shares outstanding - March 31, 2021: 579,675,002; Shares outstanding - December 31, 2020: 577,749,638 Additional paid-in capital 48 6,337 Effect of exchange rate changes on cash and cash equivalents Net increase (decrease) in cash and cash equivalents Cash and cash equivalents at beginning of year 2,281 Retained earnings 44,824 2,353 (29,236) (7,486) Treasury stock, at cost: Shares at March 31, 2021: 364,358,054; Shares at December 31, 2020: 366,283,418 Accumulated other comprehensive income (loss) Total 3M Company shareholders' equity Noncontrolling interest Total equity Total liabilities and equity 14,448 68 14,516 $ 48,307 Financial Ratios Value 0.404993065 -55.41111111 POSOTIVE VALUE 48.41 Financial Statement Values Item Short-Term Debt Long-Term Debt Total Debt Total Assets Common Equity Current Assets Current Liabilities Receivables Sales Cost of Goods Sold Operating Profit (EBIT) Interest Expense Net Income Value $3,297 $16,267 $19,564 $48,307 $14,448 $16,343 $9,440 $4,991 $32,184 $16,605 $7,161 -$17,774 $5,384 Item Debt Ratio Times Interest Earned Gross Profit Margin Basic Earning Power Return on Equity Current Ratio Average Collection Period Total Asset Turnover Equity Turnover Earnings Per Share Price-to-Earnings Ratio 37% 1.73125 56.60312578 SHOULD EQUAL TO 15.51% 66.62388474 2.227574751 $9.25 Value Value Market Values Item Price per Share Number of Common Shares Outstanding Market value of Equity Free Cash Flows Item Cash Flow from Operating Activities Tax Rate Capital Expenditure FCF Note: From the CF/S Note: the average tax rate can be used = Income Tax/Taxable income Note: Change, from the C/F Statement, any increase (expenditure) should be subtracted